10-12B: Registration of securities [Section 12(b)]
Published on January 27, 2026
Table of Contents
UNITED STATES
SECURITIES AND EXCHANGE COMMISSION
Washington, D.C. 20549
FORM 10
GENERAL FORM FOR REGISTRATION OF SECURITIES
PURSUANT TO SECTION 12(B) OR (G) OF
THE SECURITIES EXCHANGE ACT OF 1934
Sunbelt Rentals Holdings, Inc.
(Exact name of registrant as specified in its charter)
| Delaware | 33-3657151 | |
| (State or other jurisdiction of incorporation or organization) |
(I. R. S. Employer Identification No.) | |
| 1799 Innovation Pt Fort Mill, SC |
29715 | |
| (Address of principal executive office) | (Zip Code) | |
(803) 578-5800
(Registrant’s telephone number, including area code)
| With copies to: | ||||
| Oliver Lazenby David Boles Katie Bentel Freshfields LLP 100 Bishopsgate London EC2P 2SR United Kingdom 0044 207 936 4000 |
Michael A. Levitt Jacqueline A. Marino Freshfields US LLP 3 World Trade Center 175 Greenwich Street, 51st Floor New York, New York 10007 (212) 277-4000 |
Lynne Fuller-Andrews Sunbelt Rentals Holdings, Inc. 1799 Innovation Pt Fort Mill, South Carolina 29715 (803) 578-5800 | ||
Securities to be registered pursuant to Section 12(b) of the Act:
| Title of each class to be so registered |
Name of each exchange on which each class is to be registered | |
| Common Stock, par value $0.01 per share | New York Stock Exchange |
Securities to be registered pursuant to Section 12(g) of the Act:
None.
Indicate by check mark whether the registrant is a large accelerated filer, an accelerated filer, a non-accelerated filer, smaller reporting company, or an emerging growth company. See the definitions of “large accelerated filer,” “accelerated filer,” “smaller reporting company,” and “emerging growth company” in Rule 12b-2 of the Exchange Act.
| Large accelerated filer | ☐ | Accelerated filer | ☐ | |||
| Non-accelerated filer | ☒ | Smaller reporting company | ☐ | |||
| Emerging growth company | ☐ | |||||
If an emerging growth company, indicate by check mark if the registrant has elected not to use the extended transition period for complying with any new or revised financial accounting standards provided pursuant to Section 13(a) of the Exchange Act. ☐
Table of Contents
Table of Contents
ABOUT THIS REGISTRATION STATEMENT
On June 10, 2025, shareholders of Ashtead Group plc (Ashtead) approved a corporate reorganization of Ashtead pursuant to which Sunbelt Rentals Holdings, Inc. (Sunbelt Rentals), a Delaware corporation, will become the parent holding company of Ashtead (the Redomiciliation). The Redomiciliation will be implemented by means of a scheme of arrangement under the U.K. Companies Act 2006. Following the Redomiciliation, and the effectiveness of this Registration Statement, the common stock of Sunbelt Rentals, par value $0.01 per share (the Sunbelt Rentals Common Stock), will be admitted to trading (the U.S. Listing) on the New York Stock Exchange (the NYSE), with an additional listing on the London Stock Exchange (the LSE), which is the historical trading venue for the ordinary shares in Ashtead (the Ashtead Shares). See “Management’s Discussion and Analysis of Financial Condition and Results of Operations—Redomiciliation and U.S. Listing” under Item 2 (Financial Information).
Sunbelt Rentals was incorporated on February 12, 2025. It is a company with nominal assets and no liabilities, contingencies or commitments, and it conducted no operations prior to the date of this Registration Statement, and does not intend to conduct any operations prior to consummation of the Redomiciliation. Upon consummation of the transactions contemplated by the Redomiciliation, Sunbelt Rentals will become the parent holding company of Ashtead and will own the entire issued share capital of Ashtead.
Unless otherwise indicated or the context otherwise requires, in this Registration Statement, the “Company,” “Group,” “we,” “us” and “our” refer to (i) Ashtead and its consolidated subsidiaries prior to the completion of the Redomiciliation and (ii) Sunbelt Rentals and its consolidated subsidiaries after the completion of the Redomiciliation.
Sunbelt Rentals is filing this Registration Statement on Form 10 pursuant to Section 12(b) of the Securities Exchange Act of 1934, as amended (the Exchange Act), in connection with the listing of the Sunbelt Rentals Common Stock on the NYSE. The Company is not required to file this Registration Statement pursuant to the Securities Act of 1933, as amended (the Securities Act). This Registration Statement does not constitute an offer to sell, or a solicitation of an offer to buy, the Company’s securities.
Once this Registration Statement is effective, Sunbelt Rentals will be subject to the requirements of Section 13(a) of the Exchange Act, including the rules and regulations promulgated thereunder, which will require us to file, among other things, annual reports on Form 10-K, quarterly reports on Form 10-Q and current reports on Form 8-K with the U.S. Securities and Exchange Commission (the SEC), and we will be required to comply with all other obligations of the Exchange Act applicable to issuers filing registration statements pursuant to Section 12 of the Exchange Act. Beginning March 2, 2026, periodic and current reports will be available on our website, www.ir.sunbeltrentals.com, free of charge, as soon as reasonably practicable after such materials are filed with, or furnished to, the SEC. The information contained on, or accessible through, our websites does not constitute a part of this Registration Statement and is not incorporated by reference into this Registration Statement.
SPECIAL NOTE REGARDING FORWARD-LOOKING STATEMENTS
This Registration Statement contains “forward-looking statements” within the meaning of the federal securities laws, including the U.S. Private Securities Litigation Reform Act of 1995, as amended, including, without limitation, statements concerning the conditions in our industry, our operations, our economic performance and our financial condition, including, in particular, statements relating to our business and growth strategy, our product development efforts and the growth and dynamics of the market segments in which we operate in Item 1 (Business) and in “Management’s Discussion and Analysis of Financial Condition and Results of Operations” under Item 2 (Financial Information). Forward-looking statements include all statements that do not relate solely to historical or current facts, and can be identified by the use of words such as “may,” “might,” “will,” “should,” “estimate,” “project,” “plan,” “anticipate,” “expect,” “intend,” “outlook,” “believe” and other
i
Table of Contents
similar expressions. You are cautioned not to place undue reliance on these forward-looking statements, which speak only as of their dates. Forward-looking statements made in this Registration Statement speak only as of its date, and we undertake no obligation to update them in light of new information or future events, except as required by law.
These forward-looking statements are based on estimates and assumptions by our management that, although we believe to be reasonable, are inherently uncertain and subject to a number of risks and uncertainties. These risks and uncertainties include, without limitation, those identified under Item 1A (Risk Factors) and elsewhere in this Registration Statement, including, but not limited to:
| • | competition from existing and new competitors; |
| • | the impact of global economic conditions (including inflation, interest rates, supply chain constraints, tariffs, trade wars and sanctions) and geopolitical risks (including risks related to international conflicts) on us, our customers and our suppliers, in the United States and the rest of the world; |
| • | currency and interest rate fluctuations; |
| • | seasonality of our business; |
| • | our ability to attract, hire and retain qualified personnel; |
| • | our ability to successfully make acquisitions and integrate acquired companies; |
| • | changes in the rental rates that we can charge for the equipment in our rental fleet or our services; |
| • | changes in the construction and industrial markets; |
| • | changes in political, social and economic conditions and local regulations; |
| • | changes in the attitude of our customers towards renting, as compared with purchasing, equipment; |
| • | changes in applicable accounting standards or subjective assumptions, estimates and judgments by management related to complex accounting matters; |
| • | changes in the mix of products offered in our rental fleet, industry capacity or competition; |
| • | changes in environmental and safety regulations; |
| • | changes in government spending or government policies; |
| • | disruptions of established supply channels; |
| • | the availability, terms and deployment of capital; and |
| • | costs and availability of energy, and changes in transportation costs. |
The factors identified above should not be construed as an exhaustive list of factors that could affect our future results and should be read in conjunction with the other cautionary statements that are included in this Registration Statement. Furthermore, new risks and uncertainties arise from time to time, and it is impossible for us to predict those events or how they may affect us. If any of these trends, risks or uncertainties actually occurs or continues, our business, revenue and financial results could be harmed and the trading price of the Sunbelt Rentals Common Stock could decline. All forward-looking statements attributable to us are expressly qualified in their entirety by this cautionary note.
PRESENTATION OF FINANCIAL AND OTHER INFORMATION
Our fiscal year ends on April 30 of each year. Our condensed consolidated financial statements as of and for the six months ended October 31, 2025 and 2024 and our consolidated financial statements as of and for the years ended April 30, 2025, 2024 and 2023 have been prepared in accordance with generally accepted accounting principles in the United States (GAAP). We have historically conducted our business through Ashtead, and therefore, our historical consolidated financial statements included in this Registration Statement present the consolidated results of operations of Ashtead and its subsidiaries.
ii
Table of Contents
We present our consolidated financial statements in U.S. dollars. Certain of our subsidiaries maintain their books and records in their local currencies, including Canadian dollars, British pounds, euros and Bahamian dollars, which are the primary currencies of the economic environment in which their respective operations are conducted. The results of such subsidiaries are subsequently translated to U.S. dollars.
Our financial information should be read in conjunction with the section titled “Management’s Discussion and Analysis of Financial Condition and Results of Operations” under Item 2 (Financial Information) and our consolidated financial statements, including the notes thereto, included elsewhere in this Registration Statement.
NON-GAAP FINANCIAL MEASURES AND KEY PERFORMANCE INDICATORS
This Registration Statement contains certain financial measures that are not presented in accordance with GAAP, including “adjusted average net assets,” “adjusted cash conversion ratio,” “adjusted EBITDA,” “adjusted EBITDA margin,” “adjusted EPS,” “adjusted free cash flow,” “adjusted leverage,” “adjusted net assets,” “adjusted operating profit,” “adjusted operating profit margin,” “adjusted pre-tax profit,” “adjusted return on investment,” “EBITDA,” “EBITDA margin,” “free cash flow” and “net debt.” We refer to these measures as “non-GAAP financial measures.” See “Management’s Discussion and Analysis of Financial Condition and Results of Operations—Key Financial Metrics—Non-GAAP Financial Measures” under Item 2 (Financial Information) for our definitions of these non-GAAP financial measures, information about how and why we use these non-GAAP financial measures and a reconciliation of each of these non-GAAP financial measures to its most directly comparable financial measure calculated in accordance with GAAP. These financial measures are not defined or recognized under GAAP and are presented because we believe that these measures provide both management and users of our consolidated financial statements with useful additional information when evaluating its operating and financial performance. However, these non-GAAP financial measures should not be considered in isolation or as a substitute for the financial information prepared and presented in accordance with GAAP. They should not be viewed as alternatives to operating income (loss), net income (loss), operating cash flows, or other measures of financial performance or liquidity presented in accordance with GAAP. Consequently, the methodology used for their calculation may not be consistent with that adopted by other companies and, therefore, the non-GAAP measures presented in this Registration Statement may not be comparable with those of other companies. Some of the limitations of non-GAAP measures are that: (i) they do not reflect our cash expenditures or future requirements for capital investments or contractual commitments; (ii) they do not reflect changes in, or cash requirements for, our working capital needs; and (iii) they do not reflect the significant interest expense or cash requirements necessary to service interest or principal payments on our debt.
This Registration Statement also contains certain other financial measures, including “dollar utilization” and “fleet on rent”, which we consider to be key performance indicators (KPIs). See “Management’s Discussion and Analysis of Financial Condition and Results of Operations—Key Financial Metrics—Key Performance Indicators” under Item 2 (Financial Information) for information about how and why we use these KPIs. These measures are not comparable to, and should not be considered a substitute for, financial information presented in accordance with GAAP, and may differ from similarly titled metrics or measures presented by other companies.
INDUSTRY AND MARKET DATA
This Registration Statement contains estimates, projections and other information concerning our industry, our business and the markets for our products, including, but not limited to, our general expectations and market position, market opportunity and market size. Information that is based on estimates, forecasts, projections, market research or similar methodologies is inherently subject to uncertainties, and actual events or circumstances may differ materially from events and circumstances that are assumed in this information. Unless otherwise expressly stated, we obtained this industry, business, market and other data from our own internal estimates and research, as well as from reports, research surveys, studies and similar data prepared by market research firms and other third parties, industry and general publications, government data and similar sources.
iii
Table of Contents
While we are responsible for the accuracy of such information and believe our internal company research as to such matters is reliable and the market definitions are appropriate, neither such research nor these definitions have been verified by any independent source.
In addition, assumptions and estimates of our and our industry’s future performance are necessarily subject to a high degree of uncertainty and risk due to a variety of factors, including those described in Item 1A (Risk Factors). These and other factors could cause our future performance to differ materially from our assumptions and estimates. See “Special Note Regarding Forward-Looking Statements”.
NOTE REGARDING TRADEMARKS, TRADENAMES AND SERVICE MARKS
This Registration Statement includes trademarks, tradenames and service marks, certain of which belong to us and others that are the property of other organizations. Solely for convenience, trademarks, tradenames and service marks referred to in this Registration Statement appear without the ®, TM and SM symbols, but the absence of those symbols is not intended to indicate, in any way, that we will not assert our rights or that the applicable owner will not assert its rights to these trademarks, tradenames and service marks to the fullest extent under applicable law. We do not intend our use or display of other parties’ trademarks, tradenames or service marks to imply, and such use or display should not be construed to imply, a relationship with, or endorsement or sponsorship of us by, these other parties.
ENFORCEABILITY OF CIVIL LIABILITIES AGAINST FOREIGN PERSONS
Although we are organized under the laws of the state of Delaware, we also have assets located in Canada and the United Kingdom (the U.K.), as well as limited assets located in certain other jurisdictions. As a result, it may be difficult to effect service of process upon our Canadian, U.K. and other non-U.S. subsidiaries. Additionally, there is doubt as to the enforceability, in original actions in Canadian and U.K. courts, of liabilities based upon the U.S. federal securities laws or the securities laws or “blue sky” laws of any state within the United States and as to the enforceability in Canadian and U.K. courts of judgments of U.S. courts obtained in actions based upon the civil liability provisions of the U.S. federal securities laws or any such state securities laws or blue sky laws. Accordingly, it may not be possible to enforce judgments obtained in the United States against us.
iv
Table of Contents
| Item 1. | Business. |
Overview
We believe we are one of the largest international equipment rental companies by rental revenue, with a network of 1,578 stores across North America and the United Kingdom as of October 31, 2025. We conduct our equipment rental operations under the name “Sunbelt Rentals.” We believe that Sunbelt Rentals is the second largest equipment rental business in North America and the largest equipment rental company in the United Kingdom, in each case, by rental revenue. In the six months ended October 31, 2025, we generated revenue of $5,763 million, operating income of $1,279 million and adjusted operating profit of $1,445 million and in the fiscal year ended April 30, 2025, we generated revenue of $10,791 million, operating income of $2,499 million and adjusted operating profit of $2,615 million. See “Management’s Discussion and Analysis of Financial Condition and Results of Operations—Key Financial Metrics—Non-GAAP Financial Measures” under Item 2 (Financial Information) for a definition and reconciliation of adjusted operating profit to the most directly comparable GAAP measures.
Our rental equipment fleet comprises an extensive range of construction, industrial and general equipment designed to meet broad, general-purpose jobsite needs, such as mobile elevating work platforms, skid steers, forklifts, excavators, lighting equipment and small general tools. This core equipment range is complemented by Specialty business lines, including power and HVAC, climate control, scaffold services, flooring solutions, pump solutions, trench safety, industrial tool, film and television, temporary structures, ground protection, temporary fencing, and temporary walls. The original (or “first”) cost of our rental equipment fleet as of October 31, 2025 was $18,924 million and as of April 30, 2025 was $18,567 million. As of the same dates, the average age of our serialized rental equipment, which consists of individual pieces of equipment linked to a specific serial number and constitutes the substantial majority of our fleet, was approximately 51 months and 49 months, respectively, weighted on an original cost basis.
Our customers range in size and scale from multinational businesses to well-established local contractors and individual do-it-yourselfers, and include construction and industrial customers, service, repair and facility management businesses, emergency response organizations, event organizers, as well as government entities, such as municipalities and specialist contractors.
We organize and manage our operations based on geography and product and service offering. We operate under two primary geographic regions, aligned with our North American activities and assets and our U.K. activities and assets, and have further divided our North American business operationally into “General Tool” and “Specialty”, reflecting the nature of our products and services, as well as our management structure. As such, our business is divided into three reportable operational segments:
| • | North America – General Tool, which encompasses a broad selection of general construction and industrial equipment available to customers primarily in the United States and Canada. In addition, unless specified herein or otherwise clear from the context, references to this segment also include our limited operations in the Bahamas; |
| • | North America – Specialty, which includes our product groups with comparatively low rental penetration in predominantly non-construction markets, available to customers in the United States and Canada; and |
| • | United Kingdom, which delivers a comprehensive range of General Tool and Specialty products and services to customers primarily located across the United Kingdom. In addition, unless specified herein or otherwise clear from the context, references to this segment also include our limited operations in Ireland, Germany and the Netherlands. |
In the six months ended October 31, 2025, 59.0% of our revenue was attributable to the North America – General Tool segment, 32.6% of our revenue was attributable to the North America – Specialty segment and 8.4% of our revenue was attributable to the United Kingdom segment. In the fiscal year ended April 30, 2025, 59.3%
1
Table of Contents
of our revenue was attributable to the North America – General Tool segment, 32.3% of our revenue was attributable to the North America – Specialty segment and 8.4% of our revenue was attributable to the United Kingdom segment.
Competitive Strengths
We believe that we benefit from the following competitive strengths:
Geographic scale and customer diversity. We have significant geographic scale in the markets in which we operate. We believe Sunbelt Rentals is the second largest equipment rental business in North America and the largest equipment rental company in the United Kingdom, in each case, by rental revenue. As of October 31, 2025, Sunbelt Rentals North America operated 1,392 stores across all 50 U.S. states and eight provinces in Canada, of which 800 were North America – General Tool stores (including one store in the Bahamas) and 592 were North America – Specialty stores, and had rental operations in all of the top 100 North American markets (based on the size of the rental market of geographical districts across North America, as estimated by management based on public filings). As of the same date, Sunbelt Rentals U.K. operated 186 stores throughout the United Kingdom (including three stores in Ireland, Germany and the Netherlands). In North America, we achieve scale through a “clustered market” approach of grouping General Tool and Specialty rental locations in each market, allowing us to provide a comprehensive product offering and convenient service to our customers wherever their job sites may be within these markets. In the United Kingdom, our strategy is focused on maintaining a store structure that allows us to offer a full range of General Tool and Specialty equipment on a nationwide basis. In the United Kingdom, we are migrating to a regional operating center model with a few, larger locations offering a diverse range of products, combined with smaller, local locations, similar to the cluster approach we deploy in North America. This approach reflects the nature of the customer base, which is based on more national accounts, and the smaller geography of the United Kingdom.
We also benefit from our diversified customer base, with our customers ranging in size and scale from multinational businesses to well-established local contractors and individual do-it-yourselfers (see “—Customers” below). For example, in the fiscal year ended April 30, 2025, we served approximately 800,000 customers in the United States, with our top ten customers accounting for less than 10% of our total revenue and no single customer accounting for more than 1% of our total revenues. We believe that our breadth of customers, in combination with our diversified product offering, makes us more resilient to economic downturns and enables us to take advantage of end market opportunities.
Our geographic scale and diversified customer base provide us with several benefits, including (i) reducing the impact of localized economic fluctuations on our overall financial performance, (ii) reducing our dependence on any particular customer or group of customers, and (iii) enabling us to meet the needs of larger customers who increasingly demand wide geographic coverage across a broad range of equipment needs.
Differentiated product offering. Our differentiated rental fleet provides us with the ability to service a diverse customer base, to cross-market our products to our customers and to serve customers that require large quantities or different types of equipment. While the individual components of our General Tool fleet are similar to that of our peers, we offer a broad range of differentiated equipment through our Specialty business (see “—Product and Service Offering” below). We aim to offer a full-service solution for our customers in all scenarios and are often involved in supplying various types of equipment, as well as service expertise, over an extended period at each distinct stage of a project’s development. On “mega projects” (defined internally as projects with a value over $400 million) and other major long-term projects, we often provide the full range of our equipment, from small hand-held tools to larger dirt moving or aerial equipment. We believe that our focus on Specialty markets, which are typically characterized by low rental penetration and small local players, contributes to our growth as rental penetration increases and customers become accustomed to the quality and convenience of our offering.
High quality and standardized rental fleet. We purchase equipment from well-known manufacturers with strong reputations for product quality and reliability and maintain close relationships with these suppliers to ensure certainty of supply and good after-purchase service and support. We work with suppliers to provide early visibility of our equipment needs, which enables them to plan production schedules and deliver the fleet when we
2
Table of Contents
need it. Across our rental fleet, we generally carry equipment from one or two suppliers in each product range and limit the number of model types of each product. Having a standardized fleet results in lower costs, because we obtain greater discounts by purchasing in bulk and reduce maintenance costs through more focused, and therefore reduced, training requirements for our staff. We are also able to share spare parts between stores within a clustered market, which helps to minimize the risk of over-stocking, and to transfer fleet between locations easily, which enables us to achieve high levels of fleet utilization.
Significant purchasing power. As one of the largest participants in our industry, we purchase significant amounts of equipment, parts and other items from our suppliers. Our capital expenditure on rental equipment for the six months ended October 31, 2025 was $1,070 million. We believe that this level of capital expenditure enables us to negotiate favorable terms with our vendors, including in relation to pricing and warranties. As a result, we believe that we generally are able to purchase equipment at prices that are more favorable than those paid by the majority of our competitors.
Motivated local management teams. We have motivated local management teams, largely due to our strong company culture and decentralized structure, which empowers local management teams to make timely, market-specific decisions that best serve their local customer base. By entrusting local leaders with operational control, within a framework of strategic oversight, including budgetary and other controls, we foster a sense of ownership and accountability that drives performance. We believe that this approach not only enhances adaptability and responsiveness, but also ensures that decision-making remains closely aligned with the unique needs and opportunities within each clustered market that we serve. Certain members of our teams also participate in our reward and incentive programs, which we believe motivate them to maximize returns on investment and encourage them to build and reinforce relationships with our customers. We also believe that our reward and incentive programs act as an incentive to promote cross-selling between our General Tool and Specialty offerings, control costs, optimize pricing and promote efficient fleet management, while concurrently building motivated and cohesive teams focused on profitability.
Experienced senior management team. Most members of our local senior operational management teams have spent the majority of their careers in the equipment rental industry. Our senior management team presently is led by Brendan Horgan, our Chief Executive Officer, who has served in his current position since May 2019. He previously served as our Chief Operating Officer from January 2018 to May 2019 and as the Chief Executive Officer of Sunbelt Rentals North America and a director of Ashtead since January 2011. Mr. Horgan joined Sunbelt Rentals, Inc. in 1996 and has held a number of senior management positions, including Chief Sales Officer. Alex Pease, our Chief Financial Officer, joined Ashtead in October 2024 as Chief Financial Officer Designate and has served in his current position since March 2025. Mr. Pease brings more than 20 years of experience to the company, having previously served as the Chief Financial Officer of WestRock Company, with experience in finance, corporate strategy, M&A, capital markets, portfolio optimization and broad-based business transformation. In addition, our other executive officers have been employed by the Group for an average of approximately 20 years.
Focus on customer service. We believe that our focus on customer service and the guarantees we offer help distinguish our businesses from competitors and assist us in delivering strong financial returns. Responsiveness to customer needs is critical in the rental business, with customers increasingly seeking a comprehensive product offering and convenient service, often requesting delivery within 24 hours. We have a large and experienced sales force, which is focused on building and reinforcing customer relationships and to concentrate on generating strong, whole-life returns from our rental fleet. Our sales force is equipped with real-time access to fleet availability and pricing, assisting it to respond quickly to the needs of a customer while also optimizing returns. We also believe that our ability to cross-sell our General Tool and Specialty offerings is an important part of the customer experience.
Well-established brand. Sunbelt Rentals, with its distinctive logo, is well-established, and we believe well-recognized, in the markets in which we operate. We believe that our customers associate the name with high quality equipment and customer service, which fosters loyalty and enables us to attract new, as well as retain repeat, customers in our markets as we grow the business.
3
Table of Contents
Investing in the best systems. Our competitive advantage also depends on having the right systems and applications to allow our staff to deliver the highest standards of service. We make use of what we believe is industry-leading technology to further differentiate our service and capitalize on growth opportunities in the marketplace, including mobile apps and websites where customers can, among other things, manage their accounts and track deliveries, as well as systems and tools aimed to optimize our workflows (see “—Information Technology” below).
Our Strategy – Sunbelt 4.0
While our business will always be impacted by a degree of cyclicality, we believe that the continuing level of structural change in our markets, particularly in North America where we are seeing an increased shift from ownership to rental (see “—Market Opportunity” below), combined with our proven strategy of building diversification throughout the business and increased focus on non-construction end markets, is enabling us to be more resilient to economic downturns.
In April 2024, we launched our current five-year strategic growth plan, Sunbelt 4.0 – Runway for Success (Sunbelt 4.0). Sunbelt 4.0 marks the next step of our strategy and follows the successful completion of our previous strategic growth plan, Sunbelt 3.0, which was launched in April 2021. As the next step of our strategy, Sunbelt 4.0 is designed to deliver further growth, resilience and performance and will be guided by five actionable components – Customer, Growth, Performance, Sustainability and Investment – which are described in further detail below. Underpinning these five actionable components are our foundational elements that are essential to the delivery of our strategy. These are our people, our platform and innovation. Our foundational elements are present in everything we do and core to the culture of our organization, enabling us to deliver on our customer promise of Availability, Reliability and Ease. These foundational elements drive the success of our business, and as such, underpin our strategic plan.
Customer
The first of our actionable components is to elevate our focus on customer service and experience throughout the organization to a level that we believe will be truly differentiating. Customers have always been the priority at Sunbelt Rentals, but putting them front and center in our strategic plan is a step designed to further elevate that focus. As our business has changed, so too have our customers. They now rely on us to get their job done, safely, efficiently, without any hassle and often in the most sustainable way possible.
Cross-selling our General Tool and Specialty offerings is an important part of the customer experience and supports our business fundamentals. We continue to grow our customer base, particularly in North America, where we added approximately 118,000 new credit account customers under our previous strategic growth plan, Sunbelt 3.0, and a further approximately 42,000 new credit account customers in the fiscal year ended April 30, 2025, the first year of Sunbelt 4.0. Meanwhile, those customers who rent from multiple lines of business also grew over the same period. We believe that our focus on ensuring that our customers enjoy the very best customer service and experience is key to attracting new customers, while also increasing the revenue generated by existing customers.
Growth
Our second actionable component is to grow our General Tool and Specialty businesses through the ongoing structural progression of our business and industry (see “—Market Opportunity” below). We are evolving our clustered market approach as we look to increase our fleet density. We believe that there is a clear opportunity to increase the fleet density in our markets through accessing the latent capacity in our existing locations, particularly those added during our previous strategic growth plan, Sunbelt 3.0, and supplementing those through further greenfield locations (defined internally as new locations added to the Group’s store network through organic expansion rather than through bolt-on acquisitions). In this way, we aim to ensure that rental penetration increases
4
Table of Contents
in ever broadening markets as our market density grows. We aim to add 300 to 400 greenfield locations in North America during Sunbelt 4.0, of which 70 had been added as of October 31, 2025. Over the same period, 24 locations had been added by way of bolt-on acquisition.
Our clustered market approach has been an important aspect of our strategy and success at building the business to the scale that we have today and, as part of Sunbelt 4.0, we are focusing also on increasing our market density where we have existing clusters. Our greenfield sites are chosen to enhance our existing business. We focus on building clusters of stores because, as they mature, they access a broader range of markets unrelated to construction, leading to better margins and return on investment.
The size and composition of a cluster depends on the market size based on designated market areas. We have defined clusters such that a top 25 market cluster in the United States has more than 15 stores, a top 26–50 market cluster has more than 10 stores and a top 51–100 market cluster has more than four stores. We also include the smaller 101–210 markets within our cluster analysis. Our definition of a cluster in these markets is two or more stores. With the advanced technology we have in place, we are able to analyze local market data more accurately. This allows us to find similarities between certain U.S. and Canadian centers and model our growth plans accordingly. The more customers get to know and trust us, the faster we believe we will be able to grow.
We believe that the interaction of the stores in a cluster gives us real competitive advantage and that having a blend of locations, where we like to include large equipment locations alongside smaller General Tool stores, is desirable. The addition of Specialty stores serves to differentiate us from competitors in the area. This enables us to broaden and diversify our customer base and our end markets, as we extend our reach within a market. The value is in the mix of products and services we are able to provide in a concentrated environment.
Performance
Our third actionable component is performance, unlocking the capacity to operate more efficiently through process, technology and scale, with the aim of achieving margin progression with growing revenues. We see three areas of opportunity where we can drive performance:
| • | First, we aim to leverage our central and field sales and support services, using the investments made during our previous strategic growth plan, Sunbelt 3.0, as a platform for future growth. We believe that these investments provide the foundation for our next chapter of growth without the same levels of incremental cost, thus contributing to margin improvement. |
| • | Second, we aim to extract the full potential from our existing footprint and leverage our scale. We added 401 locations in North America during our previous strategic growth plan, Sunbelt 3.0, between the fiscal years ended April 30, 2021 and 2024, of which 231 were greenfield openings and 170 were added through bolt-on acquisitions. We added an additional 61 locations in the fiscal year ended April 30, 2025, the first year of Sunbelt 4.0, of which 48 were greenfield openings and 13 were added through bolt-on acquisitions. In the six months ended October 31, 2025, we added a further 33 locations, of which 22 were greenfield openings and 11 were added through bolt-on acquisitions. We believe these additional locations have the potential to contribute to revenue growth and margin progression. We believe that targeted capital investment in these locations presents an opportunity for further growth. |
| • | Third, we aim to achieve further performance advantage through market-based operational excellence programs and harnessing the power of digitally enabled solutions. During our previous strategic growth plan, Sunbelt 3.0, we launched and benefitted from dynamic pricing, order capture and eCommerce tools, while also investing in a wide range of what we believe are industry-leading technologies, including asset telematics, logistics, field service and customer-focused tools, which we are continuing under Sunbelt 4.0 and which we believe will take our technology platform to the next level. |
Sustainability
Our fourth actionable component is sustainability. We aim to advance our position as a thriving, growing enterprise to deliver long-term sustainable value for our people, customers, communities and investors.
5
Table of Contents
We endeavor to be a sustainability leader in our industry, and we have targeted an ambitious 50% reduction in Scope 1 and 2 greenhouse gas intensity by 2034 (using 2024 as the base year) on our journey to become Net Zero by 2050. We have four areas of focus within our sustainability actionable component:
| • | Operations – Committing to Scope 1 and 2 Net Zero by 2050 supported by a tangible pathway, reducing environmental impact and advancing sustainability in the value chain. |
| • | Customers – Partnering and innovating to bring new products to the rental market, while driving benefits of rental amplified by our scale. |
| • | Our people – Focusing on attracting, developing and retaining top talent and fostering inclusion and belonging, while keeping health and safety as our key priority. |
| • | Communities – Advancing an integrated community investment strategy, with 1% of post-tax profit going to community investment by 2028/29, and scaling strategic sustainability and community partnerships. |
Investment
Our fifth and final actionable component is investment, which entails disciplined capital allocation to help drive profitable growth, strong cash generation and enhanced shareholder value. We will continue to allocate capital within our clearly defined framework, focused on:
| • | organic growth investment in existing locations and greenfield sites; |
| • | bolt-on acquisitions; and |
| • | returns to shareholders through a progressive dividend policy and share repurchases to maintain our leverage within our target range. |
Maintaining financial and operational flexibility is key to adapting our business and operational models through the economic cycle, as it enables us to react quickly to both opportunities and adverse changes in the market. We also believe that having a strong balance sheet, and our consistent commitment to low leverage and a well-invested fleet, is fundamental to our success at all stages in the cycle.
We believe that we benefit from the options this strategy has provided, with the length and gradual nature of the last cycle having enabled us to establish a well-distributed fleet age. Traditionally, rental companies have often generated cash only in economic downturns, during which they tend to reduce capital expenditure and increase the age of the fleet, as opposed to economic upturns, when they tend to increase capital expenditure and focus on replacing their fleet, thus catering for future growth. However, we believe that we have changed this dynamic through the cycle with our scale and historically strong margins. During Sunbelt 4.0, we intend to utilize our free cash flow to fund our organic growth plans, bolt-on acquisitions and returns to shareholders. See also “Management’s Discussion and Analysis of Financial Condition and Results of Operations—Liquidity and Capital Resources” under Item 2 (Financial Information).
Segment Information
We organize and manage our operations based on geography and product and service offering. We operate under two primary geographic regions, reflecting our North American activities and assets and our U.K. activities and assets, and have further divided our North American business operationally into “General Tool” and “Specialty”, reflecting the nature of our products and services, as well as our management structure. As such, our business is divided into three reportable operational segments – North America – General Tool, North America – Specialty and United Kingdom – which reflect the nature of our products and services, as well as the basis upon which we review the performance of the business and allocate resources internally.
6
Table of Contents
North America – General Tool
Our North America – General Tool segment operates primarily across the United States and Canada, offering a comprehensive portfolio of general construction and industrial equipment to customers through a network of clustered markets, which is designed to meet the needs of a diverse customer base, including construction, industrial and homeowner customers, as well as service, repair, and facility management businesses. The North America – General Tool segment provides flexible rental solutions designed to meet broad, general-purpose jobsite needs, such as mobile elevating work platforms, skid steers, excavators, lighting equipment and small general tools.
We believe this segment is foundational to our business strategy and will support our continued growth through increasing fleet density, expanding our network of locations and leveraging our integrated service model.
North America – General Tool segment revenues represented 59.0% of our total revenues for the six months ended October 31, 2025 and 59.3% of our total revenues for the fiscal year ended April 30, 2025.
North America – Specialty
Our North America – Specialty segment focuses on products with comparatively low rental penetration in predominantly non-construction markets, available to customers across the United States and Canada. This segment includes products that require specialized knowledge and technical capabilities to operate and maintain, such as products relating to power & HVAC, climate control, scaffolding, film & TV equipment, flooring solutions, pump solutions, industrial tool, trench safety, ground protection, temporary structures, and temporary fencing. We have in-house experts in each business line with in-depth product and application knowledge to help provide a high level of service to our customers.
These products are often a natural add-on to our General Tool products and services, and we are continuously looking for new rental opportunities and to expand our Specialty business.
North America – Specialty segment revenues represented 32.6% of our total revenues for the six months ended October 31, 2025 and 32.3% of our total revenues for the fiscal year ended April 30, 2025.
United Kingdom
Our United Kingdom segment encompasses a full range of equipment rental solutions, predominantly available to customers across the United Kingdom. It offers both General Tool and Specialty equipment through a regionally distributed network of branches, enabling responsive, localized service and significant growth through cross-selling and targeted acquisitions in recent years, with an emphasis on areas with low rental penetration. This segment supports a diverse customer base across construction, industrial, infrastructure and energy markets.
We believe that the United Kingdom segment presents opportunities to improve operational efficiency, utilize underused capacity, and make targeted fleet investments to support growth.
United Kingdom segment revenues represented 8.4% of our total revenues for the six months ended October 31, 2025 and 8.4% of our total revenues for the fiscal year ended April 30, 2025.
Market Opportunity
Our markets continue to expand in terms of geography, range of equipment provided and the applications for which our equipment is used. In the construction end market, which remains a core part of our business,
7
Table of Contents
although now accounting for less than half of total activity, we are seeing an increasing level of crossover between our General Tool and Specialty products on any typical construction site. Construction projects are also becoming larger and longer, often completed over several years, with mega projects – which can include, for example, data centers, electric vehicle factories, battery plants and semi-conductor factories – becoming an increasingly important part of our project portfolio. In addition, our non-construction end markets are becoming increasingly large and resilient. These non-construction end markets include, among others: (i) maintenance, repair and operations, which is a stable end market characterized by recurring necessary work, regardless of what may be happening in the wider economy; (ii) sports, entertainment and special events, which is a large and stable end market with, we believe, long-term growth prospects; (iii) emergency response and restoration, which is a key market for us where we have been designated as an essential service in North America and the United Kingdom in times of need, supporting the government and the private sector with response to both day-to-day emergencies, as well as major events, including hurricanes, tornadoes and other disasters, natural disasters generating spikes in demand, and day-to-day emergencies generating steady demand; and (iv) state and local government, which is our most stable end market, with expenditures typically determined in advance and sheltered from macroeconomic shifts. We believe that there are ongoing opportunities for further rental penetration across these non-construction markets.
North America
In North America, our industry is undergoing a structural change, with a continuing shift from ownership to rental, driven by, among other things, significant cost inflation associated with the replacement of equipment, technical changes to equipment requirements, and health, safety and environmental issues, which make equipment rental more economical, easier and safer than ownership in many cases. With equipment rental becoming increasingly essential for customer success, we believe that this benefits larger, more experienced, and more capable rental companies that can position themselves to serve as partners for their customers, deliver more complex solutions, and capitalize on the growing market. While growth used to be a factor of fleet size, we believe that the equipment rental industry has matured from equipment providers into business service providers, where pricing progression will become fundamental to our operations, as we add greater value to our customers through the services and industry solutions we provide. Supported by these trends, we believe that we have entered a period of moderate growth in North America. According to a study by S&P Global Market Intelligence published in November 2025, rental industry revenue in the United States is expected to grow 2% in 2026, 3% in 2027 and 4% in 2028 (compared to 13% in 2023, 8% in 2024 and 3% in 2025) and rental industry revenue in Canada is expected to grow 1% in 2026, 9% in 2027 and 7% in 2028 (compared to 4% in 2023, 6% in 2024 and 3% in 2025).
In May 2025, the Dodge Construction Network reported continued strength in construction starts in our U.S. end markets in, with the outlook for the construction market being underpinned primarily by a surge in data center planning. Mega projects (valued at over $400 million) made up an increasing part of recent years’ construction start values and project activity continues to be robust, particularly in the data center space, with the total pipeline of mega projects starts projected to grow from approximately $840 billion in 2023 through 2025 to more than $1.3 trillion in 2026 through 2028, based on projects currently in planning. Projects of this scale and sophistication require suppliers with comparable scales, but also the expertise, experience, breadth of product and services, and financial strength to meet the needs of the customer, and is therefore a portion of the market where we believe we benefit from our scale and differentiated product and service offering.
At the same time, the local commercial construction market is weaker than in recent years, as the prolonged higher interest rate environment has weighed on local and regional developers. This predominantly impacts some of the small-, mid- and regional-sized contracts, which are an important segment of our customer base. However, the increased activity in mega projects and broader non-construction markets helped offset the weaker local non-construction activity in the fiscal year ended April 30, 2025.
Canada also remains a growing market for us, with the overall rental market estimated to be less than one-tenth of the size of the U.S. market. However, as in the United States, the Canadian market has experienced
8
Table of Contents
structural growth, as more and more types of equipment are rented for different applications, and we therefore expect similar trends in Canada.
While rental still only makes up around 55% to 60% of the North American market, this is a broad average, with penetration levels for smaller general tools, such as floor scrubbers, typically being significantly lower than the penetration levels for larger equipment, such as large aerial equipment, and we see potential for market penetration for rental equipment to reach well over 60% in North America in the medium to long term.
Market share
We believe that we are the second largest rental equipment company in North America in terms of revenue, with an estimated market share of 11%. The below graph sets out our estimated market share in North America as of December 2024.
North America Market Share
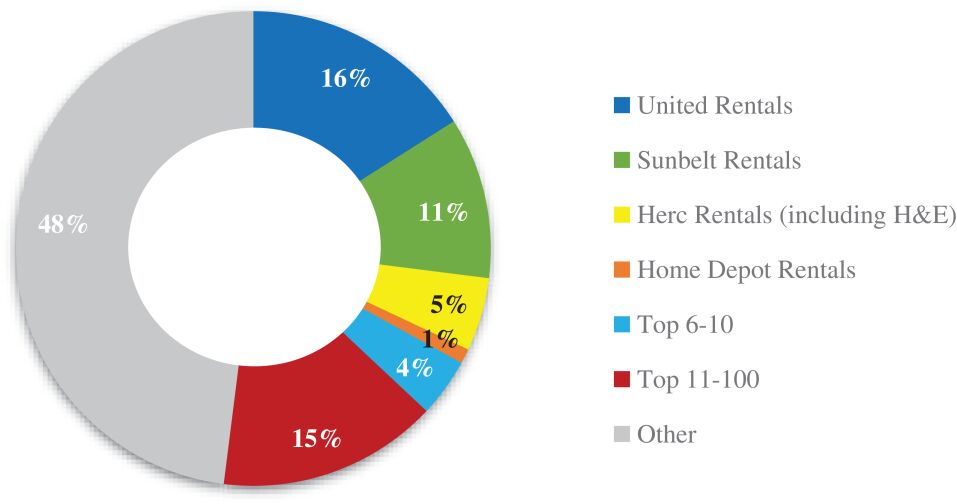
Source: Management estimate based on public filings
Our market share estimates are based on the American Rental Association’s definition of the rental market as of May 2025, which incorporates a broad range of equipment, much of which is used in non-construction applications across a wide range of end markets. These markets include facility maintenance, repair and operation across the geographic markets we serve, characterized by square footage under roof. In the United States, there are more than 100 billion square feet under roof, where we believe there is significant opportunity for further rental penetration.
As illustrated above, the three largest players in the North American market represent approximately 32% of the market in aggregate, with the remainder of the market being made up of small local independent rental shops. For example, in the United States, it is estimated that over 40% of the market is represented by rental companies with five or fewer locations. A large part of our market share gain comes from these small independents when we set up new stores or acquire them, and we believe that there is room for further consolidation in the North American market.
As the overall North American rental market grows, we believe that we are well-positioned to increase our market share by continuing to broaden our end markets and the range of our equipment, particularly within our North America – Specialty segment, as well as through bolt-on and greenfield investments.
United Kingdom
The U.K. market is more mature, competitive and fragmented than the North American market. While overall market conditions remain subdued in the United Kingdom, we continue to see significant opportunities in
9
Table of Contents
both construction and non-construction markets. In recent years, we have experienced market share gains, particularly in infrastructure and industrial projects, as well as increasing progress into areas such as facility maintenance.
Market share
We believe that we are the largest equipment rental company in the United Kingdom in terms of revenue, with an estimated 10% market share. The below graph sets out our estimated market share in the United Kingdom as of December 2024.
U.K. Market Share
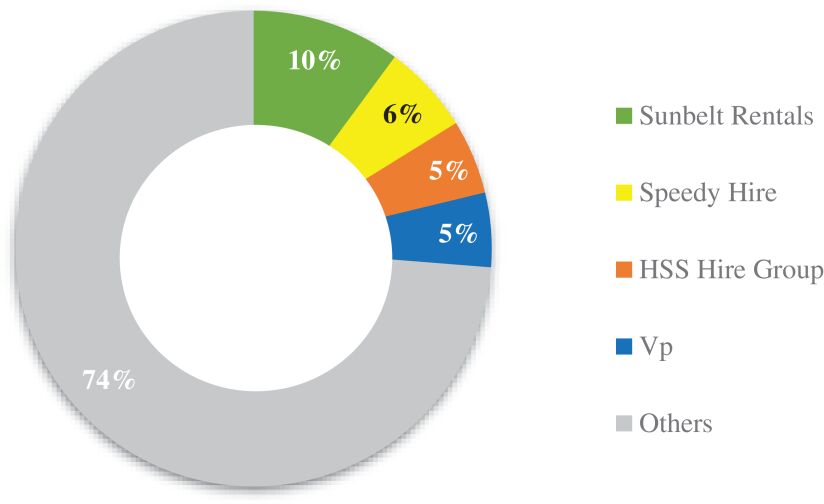
Source: Management estimate based on public filings
A consistent area of focus to improve our U.K. business has been on advancing rental rates by adding value to our customers through the services and industry solutions we provide, as well as improving operational efficiency, something in which the U.K. rental industry falls behind. We believe that we continue to be well-positioned in the market with our strong customer service, broad based fleet and a strong balance sheet. We further believe that we have enhanced our market position through simplifying our go-to-market message and leveraging the cross-selling opportunities provided by our broad product offering and Specialty business.
Product and Service Offering
We create value through the short-term rental of equipment that is used for a wide variety of applications and the provision of services and solutions to a diverse customer base through a broad platform across North America and the United Kingdom. We aim to offer a full-service solution for our customers in all scenarios, from a single rental to a long-term turnkey solution requiring technical expertise and engineered design.
Equipment Fleet Rental
Our equipment is applicable to broad and diverse end markets, with individual products having many different applications. Our rental equipment fleet comprises an extensive range of construction, industrial and general equipment designed to meet broad, general-purpose jobsite needs, such as mobile elevating work platforms, skid steers, forklifts, excavators, lighting equipment and small general tools. This core equipment range is complemented by Specialty business lines, including power and HVAC, climate control, scaffold services, flooring solutions, pump solutions, trench safety, industrial tool, film and television, temporary structures, ground protection, temporary fencing, and temporary walls.
Across our rental fleet, we generally carry equipment from one or two suppliers in each product range and limit the number of model types of each product. The size, age and mix of our rental fleet is driven by the needs
10
Table of Contents
of our customers, market conditions and overall demand. The average age of our serialized rental equipment, which constitutes the substantial majority of our fleet, as of October 31, 2025, was approximately 51 months, weighted on an original cost basis.
We strive to offer the widest variety of specialized and non-specialized equipment in the industry and believe that our rental fleet is one of the most extensive fleets in North America and the United Kingdom.
North America – General Tool
As of October 31, 2025, the original cost of our North America – General Tool fleet was $12,825 million and the average age of the fleet was approximately 50 months, weighted on an original cost basis. The table below sets out the composition of our North America – General Tool rental fleet as of the same date, by major category based on original cost.
| North America – General Tool fleet breakdown |
% of gross fleet | Original cost ($ in millions) |
||||||
| Mobile elevating work platforms |
39 | 5,035 | ||||||
| Forklifts |
25 | 3,213 | ||||||
| Earth moving |
17 | 2,171 | ||||||
| Other |
19 | 2,406 | ||||||
|
|
|
|
|
|||||
| Total |
100 | 12,825 | ||||||
North America – Specialty
As of October 31, 2025, the original cost of our North America – Specialty fleet was $4,632 million and the average age of the fleet was approximately 55 months, weighted on an original cost basis. The table below sets out the composition of our North America – Specialty rental fleet as of the same date, by major category based on original cost.
| North America – Specialty fleet breakdown |
% of gross fleet | Original cost ($ in millions) |
||||||
| Power & HVAC |
42 | 1,973 | ||||||
| Scaffold |
8 | 351 | ||||||
| Pump |
6 | 259 | ||||||
| Film & TV |
4 | 203 | ||||||
| Climate control |
2 | 83 | ||||||
| Other |
38 | 1,763 | ||||||
|
|
|
|
|
|||||
| Total |
100 | 4,632 | ||||||
United Kingdom
As of October 31, 2025, the original cost of our U.K. fleet was $1,467 million and the average age of the fleet was approximately 54 months, weighted on an original cost basis. The table below sets out the composition of Sunbelt Rentals U.K.’s rental fleet as of the same date, by major category based on original cost.
| Sunbelt Rentals U.K. fleet breakdown |
% of gross fleet | Original cost ($ in millions) |
||||||
| Accommodation |
16 | 235 | ||||||
| Panels, fencing and barriers |
11 | 157 | ||||||
| Mobile elevating work platforms |
10 | 143 | ||||||
| Film & TV |
9 | 130 | ||||||
| Earth moving |
9 | 128 | ||||||
| Forklifts |
9 | 126 | ||||||
| Other |
36 | 548 | ||||||
|
|
|
|
|
|||||
| Total |
100 | 1,467 | ||||||
11
Table of Contents
Equipment Sales
In addition to our rental business, we also routinely sell our used rental equipment on the secondary market to manage repair and maintenance costs, as well as the composition, age and size of our fleet. We utilize various channels to sell our used equipment, including retail sales to customers and other third parties through brokered sales and auctions, and directly back to manufacturers. We also sell used equipment through our website.
We also generate revenue from the sale of new equipment, merchandise and consumables. The types of new equipment that we sell vary by location and include a variety of tools and supplies, small equipment, safety supplies and consumables.
During the six months ended October 31, 2025, 93.0% of our total revenue was derived from equipment rentals, with the balance coming from sales of used rental equipment (3.6%) and sales of new equipment, merchandise and consumables (3.4%).
Customers
Our customers range in size and scale from multinational businesses to well-established local contractors and individual do-it-yourselfers, and include construction and industrial customers, service, repair and facility management businesses, emergency response organizations, event organizers, as well as government entities, such as municipalities and specialist contractors.
A large portion of our customer base comes from the commercial construction and industrial sectors. Commercial construction rentals are intended primarily to support contractors conducting new-build and repair and renovation work who rent a wide range of equipment, from power tools to backhoes. Industrial rentals support businesses conducting routine plant maintenance, as well as special projects that require welding equipment, power washing equipment, forklifts and other material handling equipment.
The nature of our business consists of a high number of relatively small transactions. As an example, in the fiscal year ended April 30, 2025, we served approximately 800,000 customers in the United States who generated an average equipment rental revenue of approximately $10,300. However, this average reflects a broad and diverse customer base, which includes our smallest customers, who transact with a single line of business, compared to our largest, who transact across most of our services. During the fiscal year ended April 30, 2025, our top ten customers accounted for less than 10% of our total revenue and no single customer accounted for more than 1% of our total revenues.
Suppliers
We purchase equipment from vendors with superior reputations for product quality and reliability, and maintain close relationships with these vendors to ensure excellent after-purchase service and support.
In North America, the five largest equipment manufacturers from which Sunbelt Rentals purchases equipment, in terms of original cost of purchases, are Clark Equipment, JCB, JLG, Multiquip and Terex. These suppliers accounted for 53.4% of our North American capital expenditure on rental equipment in the fiscal year ended April 30, 2025.
Sunbelt Rentals U.K. has continued to rationalize the number of suppliers from which it purchases new equipment. The five largest equipment manufacturers from which Sunbelt Rentals U.K. purchases equipment, in terms of original cost of purchases, are Dingli Machinery, Groundhog Sales, Greenshields JCB, Leica and NiftyLift. These suppliers accounted for 36.6% of Sunbelt Rentals U.K.’s capital expenditures on rental equipment in the fiscal year ended April 30, 2025.
We believe that Sunbelt Rentals has sufficient alternative sources of supply for the equipment we purchase in each of our product categories in each geography in which we operate.
12
Table of Contents
Sales and Marketing
We have dedicated sales forces focused on establishing and expanding our national, regional and local equipment customers in various sectors. In addition, in both North America and the United Kingdom, we have dedicated national account sales forces focused on building and reinforcing relationships with our larger customers, particularly those with a national or multi-regional presence. Our sales force is further broken down into smaller product-focused sales representative teams, which enhances the development of technical expertise.
In addition to the efforts of our sales force, we market our business through traditional outlets, such as direct mail campaigns, print advertising, telemarketing and industry trade publications.
Maintenance and Service
Rental equipment requires regular maintenance and service, with maintenance and repair costs amounting to $329 million in the six months ended October 31, 2025 and $571 million in the fiscal year ended April 30, 2025. The vast majority of our maintenance and service work is carried out locally by our Sunbelt Rentals technicians.
Costs related to maintenance and repairs, as well as the risk of equipment being out of service, typically increases as our rental equipment ages (see “—Product and Service Offering—Equipment Fleet Rental” above for further details on our fleet).
Information Technology
We believe that investing in technology is important for our continued growth and contributes to our competitive advantage in the industry.
North America
Our digital ecosystem in North America begins with our online Command Center platform, including a mobile app, where customers can access their integrated data and manage their rental equipment at any time. Customers can, among other things, track what equipment they have on rent, order new items from the entire available range, see what they have rented recently, request service or a pick-up, extend their contract, see store locations or log their favorite equipment. Our sales representatives have access to all of this information, as well as a powerful CRM tool, Customer360, which enables them to see where available equipment is located, customer contacts, preferences and potential needs, and all other information relevant to serving the customer.
These tools are enhanced further through the use of our proprietary cloud-based sourcing decision engine. Developed with over 200 logic rules based on different variables and situations, our proprietary sourcing decision engine creates automated workflows that are connected to our point of sales and logistics systems, which enable our sales representatives to focus more of their time on servicing customer needs.
Finally, our Vehicle Delivery Optimization System 4.0 (VDOS 4.0), launched in 2025, is used by dispatchers to manage deliveries and collections of equipment at job sites and to schedule drivers for these services, who are able to access VDOS 4.0 on their mobile phones, improving both equipment availability, utilization, efficiency and the user experience.
There is a significant amount of data behind each of these applications, which we reference to make efficiency gains, deliver improvements in procurement, service operations, logistics and our management of resources, add depth to our growth strategy and provide more accurate strategic forecasts.
United Kingdom
Similar to Sunbelt Rentals in North America, Sunbelt Rentals U.K. has a range of technology-based tools to enhance the customer experience and to deliver operational efficiencies. Sunbelt Rentals U.K. offers its customers an interactive website where customers can find their nearest Sunbelt Rentals U.K. store and browse Sunbelt Rentals U.K.’s range of rental equipment. In addition, Sunbelt Rentals U.K. also operates a customer
13
Table of Contents
extranet where customers can access their accounts online at any time and tailor the presentation according to their preferences. Sunbelt Rentals U.K. utilizes a sophisticated point-of-sale invoicing and asset control computer system that links all Sunbelt Rentals U.K. stores and allows Sunbelt Rentals U.K. staff to manage and control the rental fleet effectively.
These tools are supported by Sunbelt Rentals U.K.’s Logistic tool, which provides customers with real-time delivery tracking through text message and app, contactless and paperless delivery and the ability to off-hire in the same manner, providing customers with instant visibility of products on hire. Logistic is also used internally to create operational efficiencies, for example, through providing visibility of our vehicle fleet to maximize utilization and create the most efficient delivery routes for drivers.
Health and Safety
Health and safety is fundamental to our operations and a primary business goal. We are committed to the following basic principles across all of our operations:
| • | strict adherence to occupational health and safety legislation; |
| • | continuous identification and assessment of occupational risks and adoption of measures to control and mitigate them; |
| • | establishment of quantitative and qualitative targets and close monitoring of the Total Recordable Incident Rate, as well as other leading and lagging indicators relevant to our operations; |
| • | continuous provision of information and training to personnel, business partners and customers to ensure competency, equipment quality and safe working practices; and |
| • | maintenance of suitable emergency preparedness plans. |
Being a responsible business also means sharing and promoting our safety culture with our customers and suppliers whenever possible. We have the highest safety expectations for all of our equipment suppliers. Our program for recording “near misses” is an important tool we use to deliver feedback to and collaborate with our suppliers and original equipment manufacturers (OEMs). For example, if we identify heightened risk in a particular asset, we work with OEMs to repair or innovate their equipment.
Being an intermediary between customers and suppliers means we can influence and innovate in both directions. For our customers, we have dedicated equipment trainers and offer customized training programs to meet their needs. We work with customers’ safety teams to develop customized training courses, sometimes for a specific jobsite, and participate in training days for major customers, demonstrating safe use of equipment and running training seminars. This is in addition to the routine safety briefings that accompany equipment rental. As of April 30, 2025, we offered dedicated full-time safety trainers for our customers in 126 markets across North America and maintained 33 training centers in the United Kingdom.
Safety on the road for our drivers and other road users is also paramount to our business. We make use of technology in our driver safety program, such as on-board telematics, to help us prevent unsafe behaviors on the road, and dash cameras, enabling real-time feedback on behaviors that could lead to vehicle incidents (collectively known as our Road Intelligence Transportation Assistant or RITA). As of April 30, 2025, over 90% of our vehicle fleet in North America was equipped with telematics and approximately 93% was equipped with cameras. In the fiscal year ended April 30, 2025, we also launched our new system of “driver profiles” – a risk assessment tool that uses five data sources: driver’s license records, telematics events, RITA behaviors, preventable collisions and Department of Transportation records, to create safety scores for team members. The goal of the driver safety program is to assess driving behaviors and provide training and support to our drivers and reduce on-road risk.
14
Table of Contents
Environmental and Other Regulatory Matters
Our operations are subject to numerous international, national, state and local laws and regulations, including those governing environmental protection and occupational health and safety matters. These laws regulate matters such as wastewater, storm water, solid and hazardous wastes and materials and air quality. Under these laws, we may be liable for, among other things, the cost of investigating and remediating contamination at our sites, as well as sites to which we send hazardous wastes for disposal or treatment, regardless of fault, and also fines and penalties for non-compliance. We use hazardous materials to clean and maintain equipment, dispose of solid and hazardous waste and wastewater from equipment washing, and store and dispense petroleum products from underground and above ground storage tanks located at certain of our locations.
We continuously monitor current and emerging regulations to ensure that our policies and practices remain appropriate, including that our rental and vehicle fleet is compliant with engine emission standards, such as the Californian Air Emissions Standards or the London Ultra Low Emission Zone requirements. We believe that environmental regulations will continue to increase over time and the potential for government-imposed restrictions on greenhouse gas emissions, through carbon taxes and import carbon pricing mechanisms, could lead to higher operating and capital costs for our business in the future. However, since these costs are associated with the use of an asset, whether it is owned or rented, we expect them to be borne by the user of the asset and hence, in the case of rentals, be reflected in increased rental rates. The increasing level and pace of regulatory requirements also make it more burdensome for customers to maintain compliance. As such, it will be more efficient for many customers to rent rather than buy a new asset, providing an additional impetus to the structural shift across our industry from ownership to rental. We therefore believe that an increase in these types of regulations will ultimately contribute to a larger rental market, from which we are well-positioned to benefit.
Based on the conditions currently known to us, we do not believe that any pending or likely remediation and compliance costs will have a material adverse effect on our business. We cannot be certain, however, as to the potential financial impact on our business if new adverse environmental conditions are discovered or environmental and safety requirements become more stringent. If we are required to incur environmental compliance or remediation costs that are not currently anticipated by us, our business could be adversely affected depending on the magnitude of the cost. For more information about the regulatory risks we face, and how, if realized, those risks are reasonably likely to materially affect us, see the risk factor entitled “We could be adversely affected by environmental and safety requirements, which could force us to incur significant capital and other operational costs and subject us to reputational damage, fines or other penalties for non-compliance” under Item 1A (Risk Factors).
Intellectual Property
We own intellectual property, including trademarks, copyrights and trade secrets, that plays an important role in maintaining our competitive position. While no single copyright or trade secret is, in our opinion, of such value to us that our business would be materially affected by the expiration or termination thereof, taken in the aggregate, these intellectual property rights provide meaningful protection for our business. However, we view the trade name “Sunbelt Rentals” as material to our business as a whole. We own a number of secondary trade names and trademarks applicable to certain aspects of our business that we also view as important.
Competition
The equipment rental industry in both North America and the United Kingdom is highly fragmented and competitive. Our competitors include large companies, regional competitors, small independent businesses and equipment vendors and dealers.
In North America, our largest national competitors include United Rentals and Herc Rentals. The U.K. equipment rental market is much more mature than the North American market, but still fragmented. Our largest competitors in the U.K. market are Speedy Hire, HSS Hire Group and Vp.
15
Table of Contents
History
Ashtead Plant Hire Company Limited was founded in the United Kingdom in 1947 and operated as a small plant hire subsidiary company within a privately owned U.K. construction group for 37 years until we acquired it in 1984. In 1986, Ashtead listed on the main market of the LSE. In 1990, we sought to broaden our base beyond the U.K. market and purchased Sunbelt Rentals in the United States, which was a two-store business based in Charlotte, North Carolina at that time. We grew our North American business significantly in the following decade through organic new store openings and one significant acquisition in the southeastern United States, and largely through acquisitions in the United Kingdom.
In June 2000, in order to provide a platform for Sunbelt Rentals U.S.’s future growth nationwide across the United States, we completed the acquisition of BET USA, Inc., the U.S. equipment rental business of Rentokil Initial plc, for a total consideration of approximately $500 million. The BET acquisition doubled the revenue of our U.S. business and gave us a market presence on the west coast, in Texas and in the central states of the United States.
In August 2006, we made a further transformational acquisition when we acquired NationsRent Companies, Inc. for approximately $1 billion. NationsRent’s geographic reach in the United States was largely complementary to our own, and, following integration into Sunbelt Rentals U.S., Sunbelt Rentals U.S. became the national player in the U.S. equipment rental market that it is today.
After a period during which we focused on integrating the former NationsRent operations into Sunbelt Rentals U.S. and on dealing with the impact of the recession from 2008 to 2010, Sunbelt Rentals U.S. pursued an expansion strategy of same-store growth, supplemented by greenfield openings and bolt-on acquisitions.
In November 2014, Sunbelt Rentals entered the Canadian market when we acquired GWG Rentals. Following expansion by way of a number of greenfield investments and bolt-on acquisitions, we nearly tripled the size of our Canadian business through the acquisition of CRS in August 2017. Subsequently, we also added the William F. White International Inc. business to our Canadian operations in December 2019, expanding our offering in the television and film market. Since then, Sunbelt North America has pursued an expansion strategy of same-store growth, supplemented by greenfield openings and bolt-on acquisitions.
Employees
As of October 31, 2025, our worldwide workforce consisted of 25,147 full-time and 281 part-time employees, of which 21,222 were located in North America and 4,207 were located in the United Kingdom. Approximately 6% of our employees in North America are members of the laborers’, teamsters’ or operating engineers’ unions. We believe that, overall, our relations with our employees are good. Staff costs remain our largest individual cash cost and amounted to $1,314 million in the six months ended October 31, 2025 and $2,459 million in the fiscal year ended April 30, 2025.
As of October 31, 2025, approximately 96%, 96% and 91% of our qualified employees in the United States, Canada and the United Kingdom, respectively, were enrolled in a pension plan. See “Management’s Discussion and Analysis of Financial Condition and Results of Operations—Liquidity and Capital Resources—Contractual and Other Obligations—Retirement Benefit Plan Obligations” under Item 2 (Financial Information) for further information on our pension plans.
Recruiting and retaining the best talent is critical for supporting our growth plans. Our people strategy is focused on accurate recruitment, which means finding the right people for the right openings and accurately communicating to candidates what the job entails and the benefits of working for Sunbelt Rentals. Once onboarded, our investments in safety and well-being, personal and professional growth, compensation and reward structure and inclusion are important retention enablers. Some of our key initiatives include:
| • | providing well-structured and competitive reward and benefit packages that ensure our ability to attract and retain the employees we need; |
16
Table of Contents
| • | ensuring that our employees have the right working environment and equipment to enable them to do the best job possible and maximize their satisfaction at work; |
| • | investing in training and career development for our employees to support them in their careers; and |
| • | ensuring that succession plans are in place and reviewed regularly to meet the ongoing needs of our business. |
Properties
Our principal executive office is located in Fort Mill, South Carolina and is owned. In addition, we lease office buildings in London, England and Warrington, England. The principal executive office of Ashtead prior to the Redomiciliation was located in London, England.
As of October 31, 2025, we operated 1,578 stores across North America and the United Kingdom. We own 102 properties in North America and lease the remaining locations. We own 30 properties in the United Kingdom and hold a leasehold interest in the remaining locations. Each of our store locations typically includes offices for sales, administration and management, a customer showroom displaying rental equipment, an equipment service area, office accommodation and outdoor and indoor storage facilities for equipment. Each location offers a range of rental equipment dependent on the specializations of the store(s) based at the location. As of October 31, 2025, we operated 800 North America – General Tool stores, 592 North America – Specialty stores and 186 United Kingdom stores.
We do not consider any specific leased location to be material to our operations.
Legal Proceedings
We are involved in various legal proceedings, claims and governmental audits in the ordinary course of business, including, but not limited to, general liability claims (including personal injury, product liability, and property and automobile claims), indemnification and guarantee obligations, employee injuries and employment-related claims, self-insurance obligations and contract and real estate matters. In the opinion of management, based on information currently available, the ultimate disposition of these proceedings, claims and audits will not have a material adverse effect on our financial position, results of operations, or cash flows.
17
Table of Contents
| Item 1A. | Risk Factors. |
An investment in our securities involves risk. You should carefully consider the following risks, together with other information provided to you in this Registration Statement, in deciding whether to invest in our securities. If any of the events or developments described in the risk factors below actually occur, individually or together, our business, financial condition and results of operations could be materially adversely affected. Additional risks not currently known to us or that we now deem immaterial may also have a material adverse effect on our business, financial condition and results of operations. In such a case, you may lose all or part of your investment.
The following discussion contains forward-looking statements that involve risks, uncertainties and assumptions. For more information, see “Special Note Regarding Forward-Looking Statements”.
Risk Factors Summary
| • | Our industry is highly competitive, and competitive pressures could lead to a decrease in our market share or the prices we can charge. |
| • | Our revenue and operating results have historically varied from period to period, and any unexpected periods of weakness could result in an overall decline in our available cash flows. |
| • | Our industry is cyclical in nature. An economic slowdown or decrease in general economic activity could cause weakness in our end markets and have adverse effects on our revenue and operating results. |
| • | Our business, operating results, and cash flows may be adversely impacted by a rising rate of inflation. |
| • | Challenging economic conditions and the occurrence of unforeseen or catastrophic events have in the past adversely impacted, and may in the future adversely impact, us, our customers or our suppliers and, in turn, adversely affect our business, results of operations and financial condition. |
| • | Changes in U.S. foreign trade policies, including the imposition of additional tariffs and other trade barriers, and efforts to withdraw from or materially modify international trade agreements, may materially and adversely affect our business, operations and financial condition. |
| • | If we are unable to collect for services provided to our customers, our operating results would be adversely affected. |
| • | We are dependent on our relationships with key suppliers to obtain equipment and other supplies for our business on acceptable terms. |
| • | Our rental operations subject us to risks including increased maintenance costs, as our rental equipment ages, and the costs of any required replacement equipment. |
| • | Our rental fleet is subject to residual value risk upon disposition, and may not sell at the prices or in the quantities we expect. |
| • | Operational and reputational risks associated with equipment failures and high-profile and mega projects could adversely affect our business. |
| • | We have been and may in the future be involved in legal proceedings in the ordinary course of our business, and while we cannot predict the outcomes of those proceedings and other contingencies with certainty, some of these outcomes may adversely impact our business, financial condition, results of operations and cash flows. |
| • | The nature of our business exposes us to various liability claims which may exceed the level of our insurance. |
| • | We may not be able to successfully implement our growth strategy on a timely basis or at all. |
| • | Acquisitions that we have made in the past or may make in the future involve certain risks. |
| • | We could be adversely affected by environmental and safety requirements, which could force us to incur significant capital and other operational costs and subject us to reputational damage, fines or other penalties for non-compliance. |
18
Table of Contents
| • | We are subject to the laws and regulations of numerous national, state, provincial, regional and local jurisdictions, including various requirements relating to our status as a government contractor. Changes in applicable laws, regulations or requirements, or our material failure to comply with any of them, could increase our costs and have other negative impacts on our business. |
| • | Failure to comply with anti-corruption laws and regulations, anti-money laundering laws and regulations, and/or economic sanctions could result in us becoming subject to fines or penalties. |
| • | Our collective bargaining agreements and our relationship with our union-represented employees could disrupt our ability to serve our customers and lead to higher labor costs. |
| • | Currency and interest rate fluctuations may have a material impact on our business, financial condition and results of operations. |
| • | If we determine that our goodwill has become impaired, we may incur impairment charges, which would negatively impact our operating results. |
| • | Turnover of members of our management and staff and any inability to attract and retain key personnel may affect our ability to efficiently manage our business and execute our strategy. |
| • | Our business could be negatively affected if we are unable to obtain debt or equity capital as required, resulting in a decrease in our revenue and cash flows. |
| • | Changes in accounting standards or subjective assumptions, estimates and judgments by management related to complex accounting matters could significantly affect our presentation and measurement of our financial results or financial condition. |
| • | Our substantial debt could adversely affect our financial health. |
| • | The restrictive covenants associated with our debt may limit our ability to operate our business and could prohibit us from pursuing opportunities which would be beneficial to our stockholders. |
| • | We may fail to respond adequately to changes in technology and customer demands. |
| • | Disruptions in our or our third-party vendors’ information technology systems could adversely affect our operating results by limiting our ability to effectively monitor and control our operations, adjust to changing market conditions, implement strategic initiatives or support our online ordering system. |
| • | Failure to comply with data privacy and protection laws and regulations could subject us to legal liability and adversely affect our reputation and our financial performance. |
| • | Climate change and legal or regulatory responses thereto may have a long-term negative impact on our business and results of operations. |
| • | Regulators’ and stakeholders’ requirements and expectations on social and sustainability-related topics continue to evolve, and our ability to meet these requirements and expectations may have a material adverse impact on our results of operations. |
| • | The impacts of a global pandemic and similar health concerns could have a significant impact on worldwide economic conditions and a material adverse effect on our operations and financial results. |
| • | We have not yet completed our evaluation of our internal control over financial reporting in compliance with Section 404 of the Sarbanes-Oxley Act. If we fail to maintain an effective system of internal controls, or if we identify a material weakness in the future, we may not be able to accurately report our financial results or prevent fraud and, as a result, shareholders could lose confidence in our financial and other public reporting, which would harm our business and the trading price of the Sunbelt Rentals Common Stock and may cause other increases in operating costs. |
| • | We may not realize all of the benefits of the Redomiciliation and U.S. Listing, or such benefits may take longer than anticipated or may be lower than estimated. |
19
Table of Contents
Risks Related to Our Business
Our industry is highly competitive, and competitive pressures could lead to a decrease in our market share or the prices we can charge.
The equipment rental industry is highly competitive and fragmented. Many of the markets in which we operate are served by numerous competitors, including multinational equipment rental companies (like ourselves), smaller multi-regional companies and small, independent businesses with a limited number of locations. We believe that we have an 11% market share in North America and a 10% market share in the United Kingdom; as such, we have significant competition in each market in which we operate, with the U.K. rental market being comparatively more saturated with competitors than the North American market. We may encounter increased competition from existing competitors or new market entrants in the future, particularly in North America. Competitive pressures have in the past adversely affected, and could again in the future adversely affect, our revenues and operating results by, among other things, decreasing our rental volumes, depressing prices that we can charge or increasing our costs to retain our employees.
Our revenue and operating results have historically varied from period to period, and any unexpected periods of weakness could result in an overall decline in our available cash flows.
Our revenue and operating results have historically varied from period to period and may continue to do so. Certain of the factors which may cause our revenue and operating results to vary include:
| • | seasonal rental patterns, with rental activity tending to be lowest in the winter; |
| • | the timing of our expenditures for new equipment and the disposal of used equipment; |
| • | changes in demand for our equipment or the prices we charge due to changes in economic conditions, competition, project delays or other factors; |
| • | fluctuations in exchange rates or fuel costs; |
| • | general economic conditions in the markets where we operate; |
| • | the cyclical nature of our customers’ businesses, particularly those operating in the commercial construction and industrial sectors; |
| • | commodity price pressures and the resultant increase in the cost of fuel and steel to our equipment suppliers, which can result in increased equipment costs for us that we may not be able to pass through to our customers as price increases; |
| • | cost increases as a result of inflation; |
| • | other cost fluctuations, such as costs for employee-related compensation and healthcare benefits; |
| • | labor shortages, work stoppages or other labor difficulties; |
| • | potential enactment of new legislation affecting our operations or labor relations; |
| • | timing of acquisitions and new location openings and related costs; |
| • | possible unrecorded liabilities of acquired companies and difficulties associated with integrating acquired companies into our existing operations; |
| • | our effectiveness in integrating acquired businesses and new locations; |
| • | the impact and effects of public health crises, pandemics and epidemics; |
| • | supply chain or other disruptions that impact our ability to obtain equipment and other supplies for our business from our key suppliers on acceptable terms or at all; |
20
Table of Contents
| • | increases in interest rates or the aggregate principal amount of our outstanding indebtedness, and related increases in our interest expense and our debt service obligations; and |
| • | possible write-offs or exceptional charges due to changes in applicable accounting standards, store reorganizations, obsolete or damaged equipment or the refinancing of our existing debt. |
One or a number of these factors, in addition to other factors, including those discussed above under “Special Note Regarding Forward-Looking Statements”, could cause a decrease in the amount of our available cash flows.
Our industry is cyclical in nature. An economic slowdown or decrease in general economic activity could cause weakness in our end markets and have adverse effects on our revenue and operating results.
A large portion of our customer base comes from the commercial construction and industrial sectors, which are cyclical in nature. The demand for our rental equipment is directly affected by the level of economic activity in these industries, which tends to increase in line with GDP growth and decline during an economic downturn. In the past, weakness in our end markets has led to a decrease in the demand for our equipment. Such decreases adversely affected our operating results by causing our revenues to decline and, because certain of our costs are fixed, reducing our operating margins. A worsening of economic conditions, in particular with respect to our customers’ construction and industrial activities, could cause weakness in our end markets and adversely affect our revenues and operating results, the effect of which could be exacerbated due to end-market concentration. See also “—Challenging economic conditions and the occurrence of unforeseen or catastrophic events have in the past adversely impacted, and may in the future adversely impact, us, our customers or our suppliers and, in turn, adversely affect our business, results of operations and financial condition” below.
Our business, operating results, and cash flows may be adversely impacted by a rising rate of inflation.
While inflation rates moderated beginning in 2024, contributing to easing of monetary policies by major central banks, we have been, and may continue to be, impacted by heightened inflationary pressures driven by uncertainty in financial markets. Central banks in various countries may raise interest rates in response to concerns about inflation, which, coupled with reduced government spending and volatility in financial markets, may have the effect of further increasing economic uncertainty and heightening these risks. Interest rate increases or other government actions taken to reduce inflation could also result in recessionary pressures. Higher interest rates for a sustained period could also result in an economic slowdown. In addition, there have in recent years been significant inflationary trends in the cost of equipment, labor, freight costs, fuel costs and other expenses. These inflationary pressures could affect wages, the cost and availability of equipment from suppliers, the price of other products and services procured, our gross margins and our operating profit. Elevated levels of inflation may further exacerbate risks related to our suppliers’ ability to source and provide equipment, which may adversely impact our ability to meet customer demand, our customers’ ability and willingness to pursue construction projects, as well as our ability to attract, motivate and retain key personnel. If we are unable to manage the effects of inflation successfully, our business, operating results, cash flows and financial condition may be adversely affected.
Challenging economic conditions and the occurrence of unforeseen or catastrophic events have in the past adversely impacted, and may in the future adversely impact, us, our customers or our suppliers and, in turn, adversely affect our business, results of operations and financial condition.
Our business has in the recent past been adversely affected by challenging economic conditions in the United States and globally, and may in the future be adversely affected by such conditions, including as a result of unforeseen or catastrophic events, such as public health crises and epidemics (or concerns over the possibility
21
Table of Contents
of such a health crisis or epidemic), natural disasters, a prolonged shutdown of the U.S. government, terrorism, war or other geopolitical conflicts, such as Russia’s invasion of Ukraine and the conflict in the Middle East.
The following factors, among others, could adversely impact us, our customers or our suppliers and, in turn, adversely affect our business, results of operations and financial condition:
| • | instability in macroeconomic conditions; |
| • | a decrease in expected levels of infrastructure spending; |
| • | a lack of availability of credit; |
| • | the imposition of tariffs, sanctions or other measures that create barriers to, or increase the costs associated with, international trade; |
| • | inflation; and |
| • | an increase in interest rates. |
These factors have in the past resulted in, and could in the future result in, among other things, weakness in our end-markets, reduced customer demand for equipment rentals, excess fleet in the equipment rental industry, reduced availability and productivity of our employees, supply chain disruptions, increased costs (including the costs of construction materials), delayed payments from our customers and uncollectible accounts, impacts to previously announced strategic plans or impacts to our ability to raise capital on terms favorable to us, or at all.
Changes in U.S. foreign trade policies, including the imposition of additional tariffs and other trade barriers, and efforts to withdraw from or materially modify international trade agreements, may materially and adversely affect our business, operations and financial condition.
Changes in U.S. foreign trade policies could lead to the imposition of additional trade barriers and tariffs on the foreign import of certain materials and products that are relevant to our business. For example, in early 2025, the U.S. government began broadly increasing tariff rates by applying a variety of baseline, reciprocal, sectoral and country-specific tariffs on imports. The duration and extent of such tariffs, including the availability of certain exemptions on some products, continue to evolve. Other countries have announced retaliatory actions or plans for retaliatory actions. These actions have caused substantial uncertainty and volatility in financial markets and may result in additional retaliatory measures or costs on U.S. goods. We cannot predict what additional changes to trade policy will be made by the presidential administration or Congress, including whether existing tariff policies will be maintained or modified, what products may be subject to such policies or whether the entry into new bilateral or multilateral trade agreements will occur, nor can we predict the effects that any such changes would have on our business. However, such changes in U.S. trade policies, if implemented, could increase our costs and adversely impact our business and operations. In addition, changes in U.S. trade policy have resulted, and could again result, in adverse reactions from U.S. trading partners, including the imposition of their own tariffs and other responsive trade policies.
If we are unable to collect for services provided to our customers, our operating results would be adversely affected.
Equipment rental revenues represented 93.0% and 92.5% of our total revenues during the six months ended October 31, 2025 and during the fiscal year ended April 30, 2025, respectively, and our cash flows depend significantly on our ability to collect on rental agreements with customers. In the construction industry, customers choose to rent equipment rather than purchase for many reasons, including in order to preserve liquidity and deploy their capital elsewhere. However, some of our customers may still face liquidity issues and ultimately may not be able to make the payments owed to us under their rental agreements on time or at all. In recent years, we have also seen construction projects become larger and longer, and “mega projects” (defined internally as projects with a value over $400 million) are becoming an increasingly important part of our project portfolio, with the total pipeline
22
Table of Contents
of mega projects starts projected to grow from approximately $840 billion in 2023 through 2025 to more than $1.3 trillion in 2026 through 2028, based on projects currently in planning. While the nature of the risks associated with mega projects (including risk of delays, cost overruns, environmental concerns, labor disputes, and regulatory challenges) are similar to the rest of our business, they are heightened due to the scale of the projects. If we are unable to manage credit risk issues adequately, or if a worsening of economic conditions results in significantly increased delinquencies and credit losses, our operating results would be adversely affected.
We are dependent on our relationships with key suppliers to obtain equipment and other supplies for our business on acceptable terms.
We have achieved significant cost savings by centralizing equipment and non-equipment purchases. However, as a result, we depend on a smaller group of key suppliers. For the fiscal year ended April 30, 2025, we purchased approximately 50% of our rental equipment from our five largest suppliers (Clark Equipment, JCB, JLG, Multiquip and Terex). While we make every effort to evaluate our counterparties prior to entering into long-term and other significant procurement contracts, we cannot predict the impact on our suppliers of changes in the economic environment or adverse developments in their respective businesses or industries. Insolvency, financial difficulties or other factors may result in our suppliers being unable to fulfill the terms of their agreements with us, being unable to renew or extend contracts on favorable terms to us or at all, or seeking to renegotiate existing contracts with us. Although we believe that we have sufficient alternative sources of supply for the equipment and other supplies used in our business, termination of our relationship with any of our key suppliers could have a material adverse effect on our business, financial condition, results of operations and cash flows in the event that we were unable to obtain adequate equipment or supplies from other sources in a timely manner or at all. Additionally, if one of these manufacturers shuts down or if two or more of them consolidate operations, this could have a significant effect on supply and pricing of equipment and, consequently, could have a material adverse effect on our business, financial condition and results of operations.
Our rental operations subject us to risks including increased maintenance costs, as our rental equipment ages, and the costs of any required replacement equipment.
As rental equipment ages, maintenance costs increase and eventually equipment needs to be replaced. The cost of new equipment has increased in recent years and may continue to increase in the future due to increased material costs for our suppliers, including due to tariffs on raw materials or other factors beyond our control. Changes in customer demand or the regulatory landscape could cause certain of our existing equipment to become obsolete, requiring us to purchase new equipment at increased costs. Any material increase in our equipment rental or replacement costs could have a material adverse effect on our financial condition, results of operations and cash flows.
Our rental fleet is subject to residual value risk upon disposition, and may not sell at the prices or in the quantities we expect.
Once we have ceased renting a certain piece of equipment (on average, after seven to eight years of ownership), we sell it in the second-hand market and receive a portion of the original purchase price in disposal proceeds. The market value of any given piece of rental equipment could be less than its depreciated value at the time it is sold. The market value of used rental equipment depends on several factors, including:
| • | the market price for comparable new equipment; |
| • | the year that it is sold; |
| • | the supply of similar used equipment on the market; |
| • | the existence and capacities of different disposal channels; |
| • | the age of the equipment, and the amount of usage of such equipment relative to its age and the effectiveness of preventive maintenance, at the time it is sold; |
| • | worldwide and domestic demand for used equipment; |
23
Table of Contents
| • | the effect of advances and changes in technology in new equipment models; and |
| • | general economic conditions. |
We include in income from operations the difference between the sales price and the depreciated value of an item of equipment sold. Changes in our assumptions regarding depreciation could change our depreciation expense, as well as the gain or loss realized upon disposal of equipment. Sales of our used rental equipment at prices that fall significantly below our expectations and/or in lesser quantities than we anticipate could have a negative impact on our financial condition, results of operations and cash flows.
Operational and reputational risks associated with equipment failures and high-profile and mega projects could adversely affect our business.
Our rental equipment is used in a wide range of applications, including critical infrastructure and live events, where even momentary disruptions can have serious consequences for customers and end-users. Such failures may result in reputational damage, especially if they attract negative media attention.
Additionally, our involvement in high-profile, politically sensitive projects and/or large-scale mega projects across North America and the U.K. introduces distinct reputational and operational risks. Projects involving government entities, energy infrastructure, or politically contentious policy areas may be perceived as aligning our business with a particular position on controversial matters, potentially leading to public disapproval, negative media coverage, social media campaigns, and stakeholder scrutiny. Mega projects, due to their complexity and visibility, are prone to delays, cost overruns, environmental concerns, labor disputes, and regulatory challenges. Any association with such issues, even if we are not directly responsible, may negatively impact our reputation and stakeholder trust. The high-profile nature of these projects can amplify reputational consequences and increase exposure to litigation or regulatory inquiry.
In both scenarios, reputational harm may impair our brand image, reduce customer loyalty, and strain relationships with stakeholders. It may also lead to decreased demand for our services and difficulties in attracting and retaining talent. While we strive to operate with integrity and neutrality, we cannot fully control the public perception of the projects we support. Any material harm arising from these risks could significantly impact our business, financial condition, and results of operations.
We have been and may in the future be involved in legal proceedings in the ordinary course of our business, and while we cannot predict the outcomes of those proceedings and other contingencies with certainty, some of these outcomes may adversely impact our business, financial condition, results of operations and cash flows.
We have been and may in the future be involved in legal proceedings that arise from time to time in the ordinary course of our business, including, but not limited to, general liability claims (including personal injury, product liability, and property and automobile claims), indemnification and guarantee obligations, employee injuries and employment-related claims, self-insurance obligations and contract and real estate matters. In future periods, we could be subject to cash costs or non-cash charges to earnings if any of these litigation matters are resolved on unfavorable terms, or if our estimates regarding legal provisions accounting or our insurance coverage are incorrect. Shareholders are also able to pursue derivative actions on behalf of the Company, for, among other things, alleged breaches of fiduciary duties by our directors and officers. If we face such litigation, it could result in substantial costs and a diversion of management’s resources and attention, which could harm our business and the value of the Sunbelt Rentals Common Stock.
Litigation is inherently unpredictable, and the outcome of some of these proceedings and other contingencies could require us to take or refrain from taking actions which could adversely impact the business or could result in excessive verdicts. Any such outcome could have an adverse effect on our business, financial condition, results of operations and cash flows. Additionally, involvement in these lawsuits and related inquiries and other proceedings may involve significant expense, divert management’s attention and resources from other matters, and negatively affect our reputation.
24
Table of Contents
The nature of our business exposes us to various liability claims which may exceed the level of our insurance.
In the ordinary course of our business operations, we are exposed to a variety of potential claims. These claims include those relating to personal injuries or property damage arising from: (i) the use and/or operation of our rented or sold equipment, (ii) motor vehicle accidents involving our vehicles and our employees, and (iii) employment-related claims. Currently, we carry a broad range of insurance for the protection of our assets and operations and we also self-insure for certain types of claims. However, such insurance and self-insurance may not fully cover these claims for a number of reasons, including:
| • | our insurance policies, reflecting a program structure that we believe reflects market conditions for companies of our size, are often subject to significant deductibles or self-insured retentions; |
| • | we do not currently maintain Group-wide stand-alone first party coverage for environmental liability (other than legally required and third-party site pollution coverage), since we believe the cost for such coverage is high relative to the benefit it provides; and |
| • | certain types of claims, such as claims for punitive damages or for damages arising from intentional misconduct, which are often alleged in third-party lawsuits, might not be covered by our insurance. |
We establish and evaluate our loss reserves on an annual basis to address casualty claims, or portions thereof, not covered by our insurance policies or self-insurance. To the extent that we are subject to a higher frequency of claims, are subject to more serious claims or insurance coverage is not available, we could have to significantly increase our reserves, and our liquidity and operating results could be materially and adversely affected. It is also possible that some or all of the insurance that is currently available to us from third parties will not be available in the future on economically reasonable terms or at all.
We may not be able to successfully implement our growth strategy on a timely basis or at all.
Our future success depends, in large part, on our ability to implement our growth strategy, including expanding our product and service offering and adding more store locations. As part of our current growth strategy, Sunbelt 4.0, we are seeking to expand our General Tool and Specialty businesses and evolve our clustered market approach as we look to increase our fleet density. During Sunbelt 4.0, we aim to add 300 to 400 greenfield locations (defined internally as new locations added to the Group’s store network through organic expansion rather than through bolt-on acquisitions), of which 70 had been added as of October 31, 2025, and we will continue to consider potential bolt-on acquisitions.
Our ability to implement our growth strategy depends on several factors, a number of which are outside our control, and there is no assurance that we will be able to open additional greenfield locations on the scale we envision. For example, delays or failures in finding suitable locations and opening new stores; achieving lower than expected sales in new or existing stores; higher than anticipated store costs; the inability to increase awareness of our brand and product offering in a cost-effective manner, or at all; any failure to achieve targeted results associated with the implementation of operational programs and initiatives, including investments in new technology; or the lack of availability of sufficient funds for expansion (see also “—Acquisitions that we have made in the past or may make in the future involve certain risks” below), could all have an adverse effect on our growth and/or profitability. As a result, we may not open the number of greenfield locations we envision, and such locations, if opened, may not be successful or profitable due to many factors. In addition, while we seek to increase our fleet density in the markets in which we operate, there is a risk that opening further stores in markets where we are already well-established could result in the cannibalization of sales from our existing stores.
Acquisitions that we have made in the past or may make in the future involve certain risks.
We have historically achieved a portion of our growth through acquisitions, and we will continue to consider potential acquisitions on a selective basis. From time to time, we have also approached other public companies or large privately held companies to explore consolidation opportunities, and we have also been approached by other public companies or large privately held companies with respect to strategic transactions.
25
Table of Contents
It is possible that we will not realize the expected benefits from our acquisitions (whether historical or future) or that our existing operations will be adversely affected as a result of acquisitions. Acquisitions involve certain risks, including but not limited to:
| • | unrecorded or otherwise unknown liabilities of acquired companies, including failures in compliance, that we fail to discover during our due diligence investigations, that are not subject to indemnification or reimbursement by the seller, or that we have otherwise assumed the risk of; |
| • | difficulty in assimilating the operations, information technology and personnel of the acquired companies within our existing operations or in maintaining uniform standards; |
| • | expansion into businesses outside of our core competencies that may not perform as expected or that customers may not value; |
| • | loss of key employees of the acquired companies; |
| • | the failure to achieve anticipated synergies; and |
| • | strains on management and other personnel time and resources to evaluate, negotiate and integrate acquisitions. |
Our failure to address these risks or other problems encountered in connection with any past or future acquisitions could cause us to fail to realize the anticipated benefits of the acquisitions over the timeframe we expect, or at all, cause us to incur unanticipated liabilities or harm our existing operations or our business generally. In addition, if we are unable to successfully integrate our acquisitions with our existing business, we may not obtain the advantages that the acquisitions were intended to create, which may materially and adversely affect our business, results of operations, financial condition and cash flows, our ability to introduce new services and products and the market price of our stock.
We would expect to pay for any future acquisitions using cash or equity or through the incurrence of and/or assumption of indebtedness. To the extent that our existing sources of cash are not sufficient, we would expect to need additional debt or equity financing. Each type of financing involves its own risks. Equity financing (including by way of convertible debt) may have a significant dilutive effect on our existing stockholders. Debt financing may create or magnify risks with respect to our leverage and debt service costs and could subject the Company or its subsidiaries to restrictive covenants which limit our operating flexibility or ability to pursue opportunities that would be beneficial to shareholders (see also “—The restrictive covenants associated with our debt may limit our ability to operate our business and could prohibit us from pursuing opportunities which would be beneficial to our stockholders” below). If one or more acquisitions result in our becoming substantially more leveraged on a consolidated basis, our flexibility in responding to adverse changes in economic, business or market conditions may be adversely affected, which could have a material adverse effect on our business, financial condition, results of operations and cash flows. If the goodwill that we record in connection with an acquisition becomes impaired, it could require charges to earnings, which would have a negative impact on our financial condition and results of operations. See “—If we determine that our goodwill has become impaired, we may incur impairment charges, which would negatively impact our operating results” below for more information.
We could be adversely affected by environmental and safety requirements, which could force us to incur significant capital and other operational costs and subject us to reputational damage, fines or other penalties for non-compliance.
Our operations require the handling, use, storage and disposal of certain regulated materials. As a result, we are subject to the requirements of various federal, state, provincial, regional and local laws and regulations in the various countries in which we operate governing protection of the environment and occupational health and safety. These laws and regulations regulate such issues as waste water, storm water, solid and hazardous wastes and materials and air quality. Under these laws, we may be liable for, among other things, the costs of investigating and remediating contamination at our sites, as well as sites to which we sent hazardous wastes for
26
Table of Contents
disposal or treatment, regardless of fault, and fines and penalties for non-compliance. We use hazardous materials to clean and maintain equipment, dispose of solid and hazardous waste and waste water from equipment washing and store and dispense petroleum products from underground and above ground storage tanks located at certain of our locations.
We may not at all times be in complete compliance with all such requirements. We are subject to potentially significant fines or penalties, as well as reputational damage, if we fail to comply with any of these requirements. We have made, and will continue to make, capital and other expenditures in order to comply with these laws and regulations, and we have purchased insurance to cover certain environmental liabilities. However, the requirements of these laws and regulations are complex, change frequently and could become more stringent in the future. It is possible that these requirements will change or that liabilities that are not covered by our insurance coverage will arise in the future in a manner that could have a material adverse effect on our business, financial condition, results of operations and cash flows.
Based on the conditions currently known to us, we do not believe that any pending or likely remediation and compliance costs will have a material adverse effect on our business. We cannot be certain, however, as to the potential financial impact on our business if new adverse environmental conditions are discovered or environmental and safety requirements become more stringent. If we are required to incur environmental compliance or remediation costs that are not currently anticipated by us, our business could be adversely affected, depending on the magnitude of the cost. For more information, see “Environmental and Other Regulatory Matters” under Item 1 (Business).
We are subject to the laws and regulations of numerous national, state, provincial, regional and local jurisdictions, including various requirements relating to our status as a government contractor. Changes in applicable laws, regulations or requirements, or our material failure to comply with any of them, could increase our costs and have other negative impacts on our business.
We operate primarily in the United States, Canada and the United Kingdom and are subject to the laws and regulations of each country, including those specific to government contractors. These laws and regulations address multiple aspects of our operations, such as worker safety, consumer rights, data privacy, environmental protections, employee benefits and labor relations and may also impact other areas of our business, such as pricing. Changes in any laws or regulations, or any material failure to comply with them, may increase our costs, cause reputational damage, require significant management time and attention and otherwise adversely impact our operations.
Failure to comply with anti-corruption laws and regulations, anti-money laundering laws and regulations, and/or economic sanctions could result in us becoming subject to fines or penalties.
We are subject to various federal and foreign laws and regulations regarding anti-corruption, anti-money laundering, and economic sanctions. These include the U.S. Foreign Corrupt Practices Act of 1977, as amended, which prohibits, among other things, payments, offers, or promises made for the purpose of improperly influencing any act or decision of a foreign official, as well as the U.K. Bribery Act of 2010. We are also subject to economic sanctions and export controls rules and regulations imposed by, among others, the U.S. Department of the Treasury’s Office of Foreign Assets Control, the U.S. Department of Commerce, other agencies of the U.S. government, HM Treasury and other agencies of the U.K. government, the European Union, and the United Nations. Any expansion, broadened or changed interpretation, variation or addition to these rules and regulations could impose significant compliance costs on us.
We have mechanisms in place to help ensure compliance with applicable anti-corruption, anti-money laundering, and economic sanctions rules and regulations, and applicable self-regulatory industry codes by region that the Company has committed to follow. However, there can be no assurance that our policies and procedures will be followed at all times or will effectively detect and/or prevent violations of these rules and regulations by
27
Table of Contents
our employees, consultants, sub-contractors, agents and partners. As a result, in the event of non-compliance, we could be subject to legal proceedings, fines and/or civil or criminal penalties, the disgorgement of profits, damage to our reputation and resulting loss of revenue and profits, which could have a material adverse impact on our business, financial condition and results of operations.
Our collective bargaining agreements and our relationship with our union-represented employees could disrupt our ability to serve our customers and lead to higher labor costs.
As of October 31, 2025, approximately 6% of our employees in North America are represented by unions and/or covered by collective bargaining agreements. There can be no assurance that our non-unionized employees in North America, the United Kingdom or elsewhere will not become members of a union and/or become covered by a collective bargaining agreement, including through an acquisition of a business whose employees are subject to such an agreement. If we experience a prolonged labor dispute involving a significant number of our employees or garnering significant public attention, our business would be adversely affected. Union organizing efforts or collective bargaining negotiations could potentially lead to work stoppages and/or slowdowns or strikes by our employees, which could adversely affect our ability to service our customers. Actual or threatened labor disputes, or an increase in the number of our employees covered by collective bargaining agreements, may have negative effects on our labor and litigation costs, as well as our productivity and flexibility. Furthermore, our labor costs could increase as a result of the settlement of actual or threatened labor disputes. See “Employees” under Item 1 (Business).
Currency and interest rate fluctuations may have a material impact on our business, financial condition and results of operations.
Although our reporting currency is the U.S. dollar, we derived 15.1% and 14.7% of our revenue for the six months ended October 31, 2025 and for the fiscal year ended April 30, 2025, respectively, from companies that have non-U.S. dollar currencies, primarily British pounds and Canadian dollars from our U.K. and Canadian businesses, respectively. Consequently, any change in exchange rates between the U.S. dollar and the pound or the Canadian dollar will affect our consolidated income statement and balance sheet when our results are translated into U.S. dollars for reporting purposes. Thus, fluctuations in the value of the U.S. dollar with respect to the pound or the Canadian dollar may have an impact on our financial condition and results of operations.
We are also exposed to interest rate risk on our floating rate debt under the ABL Facility (as defined below), and fluctuations in interest rates may affect our interest expense under the ABL Facility and any new debt arrangement. We periodically utilize interest rate swap agreements to manage and mitigate our exposure to changes in interest rates. As such, our financial condition and results of operations may be materially adversely affected by increases in interest rates.
For more information, see “Management’s Discussion and Analysis of Financial Condition and Results of Operations—Quantitative and Qualitative Disclosures about Market Risk” under Item 2 (Financial Information).
If we determine that our goodwill has become impaired, we may incur impairment charges, which would negatively impact our operating results.
As of October 31, 2025, we had $3,401 million of goodwill on our consolidated balance sheet. Goodwill represents the excess of cost over the fair value of net assets acquired in business combinations. We assess potential impairment of our goodwill at least annually. Impairment may result from significant changes in the value or manner of use of acquired assets, including due to obsolescence, negative industry or economic trends and/or significant underperformance relative to historical or projected operating results. An impairment of our goodwill may have a material adverse effect on our results of operations.
28
Table of Contents
Turnover of members of our management and staff and any inability to attract and retain key personnel may affect our ability to efficiently manage our business and execute our strategy.
Our business depends on the quality of, and our ability to retain, our senior management and staff, and competition in our industry and the business world for top management talent is significant. Although we believe we have competitive pay packages, we can provide no assurance that our efforts to attract and retain senior management staff will be successful. In the past, we have experienced volatility in our stock price, and we may experience such volatility again in the future, which may make it more difficult and expensive to recruit and retain employees, particularly senior management, through grants of equity-based awards. This, in turn, could place greater pressure on us to increase the cash component of our compensation packages, which may adversely affect our results of operations. In addition, the loss of services of certain members of our senior management could adversely affect our business until suitable replacements can be found. There may be a limited number of persons with the requisite skills to serve in these positions, and there can be no assurance that we would be able to locate or employ such qualified personnel on terms acceptable to us or at all. In addition, we depend upon the quality of our staff personnel, including drivers, technicians, as well as sales and customer service personnel, who routinely interact with and fulfill the needs of our customers. In recent years, we have seen a shortage of skilled trade workers, with more skilled trade workers retiring than entering the workforce, and a higher number of lateral hires, particularly as non-compete clauses are subject to increasing legal scrutiny in the United States and may not always be enforceable. Although we believe we have established competitive pay and benefit packages, training and career development opportunities, as well as the right working environment for our staff, there is no assurance that we will be able to find staff personnel with the requisite skills and experience or ensure that they stay with us. A significant increase in staff turnover, or an inability to locate and employ skilled staff personnel as our business grows, could negatively affect our business, financial condition, results of operations and cash flows.
Our business could be negatively affected if we are unable to obtain debt or equity capital as required, resulting in a decrease in our revenue and cash flows.
We require capital for, among other purposes, purchasing rental equipment to replace existing equipment that has reached the end of its useful life and for growth resulting from establishing new rental locations or stores, completing acquisitions and repaying existing debt, including our $550 million Senior Notes that mature in August 2026. If the cash that we generate from our business, together with cash that we may borrow under our ABL Facility, is not sufficient to fund our capital requirements, we will require additional debt and/or equity financing. If such additional financing is not available to fund our capital requirements, we could suffer a decrease in our revenue and cash flows that would have a material adverse effect on our business. Moreover, if we are required to refinance existing debt at significantly higher interest rates, this could have a material adverse effect on our financial condition, results of operations and cash flows. If we are unable to meet our debt service obligations or fund our other liquidity needs, we may be required to:
| • | reduce or delay capital expenditures; |
| • | limit our growth; |
| • | seek additional debt financing or equity capital; |
| • | forego opportunities, such as the acquisitions of other businesses; |
| • | sell assets; and/or |
| • | restructure or refinance our debt. |
Furthermore, our ability to incur additional debt is and will be subject to, among other things, the indentures governing the Senior Notes (as defined below) and the ABL Facility, including limitations on the amount of indebtedness we may incur. We cannot be certain that any additional financing that we require will be available or, if available, will be available on terms that are satisfactory to us. If we are unable to obtain sufficient
29
Table of Contents
additional capital in the future, our business could be materially adversely affected. See “Management’s Discussion and Analysis of Financial Condition and Results of Operations—Liquidity and Capital Resources” under Item 2 (Financial Information).
Changes in accounting standards or subjective assumptions, estimates and judgments by management related to complex accounting matters could significantly affect our presentation and measurement of our financial results or financial condition.
The accounting standards and related accounting pronouncements, implementation guidelines and interpretations that are relevant to our business, such as revenue recognition and net sales, asset impairment, impairment of goodwill and other intangible assets, inventories, lease obligations, self-insurance, tax matters, pensions and litigation, are complex, may be subject to change, and require us to make subjective assumptions, estimates and judgments. If these accounting standards or their interpretation change or management’s underlying assumptions and estimates or judgments change, we may be required to significantly change how we measure or report our financial performance or financial condition.
Our substantial debt could adversely affect our financial health.
We have a significant amount of debt and significant debt service obligations. As of October 31, 2025, we had total debt of $7,680 million, represented by $6,158 million in outstanding Senior Notes and $1,522 million (excluding letters of credit totaling $5 million) outstanding under our ABL Facility. The available borrowing amount under the ABL Facility as of such date was $3,431 million. Our substantial debt could have important adverse consequences for us and you as a holder of Sunbelt Rentals Common Stock. For example, our substantial debt may:
| • | require us to dedicate a large portion of our cash flows from operations to fund payments on our debt, thereby reducing the availability of our cash flows to fund working capital, capital expenditures and other general corporate needs; |
| • | increase our vulnerability to adverse general economic or industry conditions or cycles; |
| • | limit our flexibility in planning for, or reacting to, changes in our business or the industry in which we operate; |
| • | limit our ability to raise additional debt or equity capital in the future; |
| • | restrict us from making strategic acquisitions or exploiting business opportunities; and/or |
| • | could place us at a competitive disadvantage compared to our competitors that have less debt. |
Our ability to make scheduled payments on and to refinance our indebtedness depends on and is subject to our financial and operating performance, which in turn is affected by general and regional economic, financial, competitive, business and other factors, all of which are beyond our control, including the availability of financing in the international banking and capital markets. Our business may not generate sufficient cash flow from operations and future borrowings may not be available to us in an amount sufficient to enable us to service our debt, to refinance our debt or to fund our other liquidity needs.
In addition, our indebtedness pursuant to the ABL Facility bears interest at variable rates that are linked to changing market interest rates, which exposes us to interest rate risk. If interest rates associated with our floating debt rate (e.g., SOFR for U.S. dollar loans, CORRA for Canadian dollar loans and SONIA for British pound loans) increase, our debt service obligations under the ABL Facility will increase, even though the amount borrowed remain the same, and our net income and cash flows, including cash available for servicing the debt, will correspondingly decrease. Although we from time to time may hedge a portion of our exposure to variable interest rates by entering into interest rate swaps, there can be no assurance that we will put such hedging in place in the future or that such hedging would be effective. As a result, any significant or sustained increase in market interest rates would increase our interest expense and our debt service obligations, thereby adversely affecting our business and financial condition.
30
Table of Contents
The restrictive covenants associated with our debt may limit our ability to operate our business and could prohibit us from pursuing opportunities which would be beneficial to our stockholders.
The instruments governing certain of our debt impose significant operating and financial restrictions on us. These restrictions limit, among other things, our ability and the ability of certain of our subsidiaries to:
| • | incur, assume or guarantee additional debt; |
| • | pay dividends or make distributions on our stock or redeem, repurchase or retire for value our stock or subordinated debt; |
| • | make investments or loans or acquire other entities; |
| • | issue or sell stock of restricted subsidiaries; |
| • | engage in transactions with affiliates; |
| • | create liens on assets; |
| • | sell, assign, lease, consign or otherwise dispose of any assets or property; |
| • | enter into sale and leaseback transactions; |
| • | make payments on subordinated debt or amend or modify the terms of indentures or certain other debt documents; |
| • | in the case of a subsidiary that is not a subsidiary guarantor, guarantee our debt or debt of any other subsidiary; |
| • | enter into new lines of business; and |
| • | sell all or substantially all of our properties and assets or merge or consolidate with or into another company. |
Our asset-based, non-amortizing, senior secured revolving credit facility agreement (as amended from time to time, the ABL Facility Agreement) contains a financial covenant requiring the satisfaction of a minimum fixed charge ratio of 1.00 to 1.00 if our excess availability falls below 10% of total revolving commitments under our $4.75 billion first priority senior secured credit facility (the ABL Facility). As of October 31, 2025, the threshold was $475 million and our excess availability under the ABL Facility exceeded this amount.
These restrictions could limit our ability to obtain future financing, make needed capital expenditures, withstand a downturn in our business, or otherwise conduct necessary corporate activities. Our failure to comply with these restrictions could lead to a default under the terms of the relevant debt even if we were able to meet the related debt service obligations.
If there were an event of default under the ABL Facility Agreement, the indentures governing the Senior Notes or other debt, the holders of the affected debt could elect to accelerate such debt, declaring all of such debt to be immediately due and payable, which, in turn, could cause much of our other debt to become immediately due and payable. Upon such an event, we might not have sufficient funds available to satisfy such obligations, and we might be unable to obtain sufficient funds from alternative sources on terms favorable to us or at all. If the amounts outstanding under our ABL Facility were accelerated and we could not obtain sufficient funds to satisfy our obligations, our lenders could proceed against our assets and the stock and assets of our subsidiaries that guarantee the ABL Facility and the Senior Notes.
We may fail to respond adequately to changes in technology and customer demands.
In recent years, our industry has been characterized by rapid changes in technology and customer demands, and we have made significant investments in technology to further differentiate our service and capitalize on
31
Table of Contents
growth opportunities in the marketplace, including mobile apps and websites where customers can, among other things, manage their accounts and track deliveries, as well as systems and tools aimed to optimize our workflows. Our ability to continually improve our current processes and customer-facing tools in response to changes in technology, including artificial intelligence (AI), or changes in customer expectations, is essential in maintaining our competitive position and maintaining current levels of customer satisfaction. We may experience technical or other difficulties that could delay or prevent the development or implementation of new technologies. We also may not achieve the benefits that we anticipate from new technologies that we develop or implement. Moreover, the use and implementation of new technology, particularly AI, may also be associated with increasing costs, as new laws and regulations relating to information security and data privacy and protection emerge. The effects of these risks may, individually or in the aggregate, materially adversely affect our results of operations, liquidity and cash flows.
Disruptions in our or our third-party vendors’ information technology systems could adversely affect our operating results by limiting our ability to effectively monitor and control our operations, adjust to changing market conditions, implement strategic initiatives or support our online ordering system.
We rely on the continuous and uninterrupted performance of our and our third-party vendors’ information technology systems, including our point-of-sale information technology platforms, to facilitate our ability to monitor and control our assets and operations, adjust to changing market conditions and customer needs, and support our online ordering system. These systems may be subject to interruptions due to technological errors, bugs, defects or vulnerabilities, system capacity constraints, human errors, computer or communications failures, power loss, disruption during upgrades or replacements of software or hardware or integrations of acquired business systems, adverse acts of nature and other unexpected events. Any disruptions in these systems or the failure of these systems to operate as expected could, depending on the magnitude of the problem, adversely affect our operating results by limiting our capacity to effectively record, monitor and control our assets and operations, and adjust to changing market conditions in a timely manner. Moreover, because our point-of-sale systems sometimes contain information about individuals and businesses, our failure to appropriately safeguard the security of the data we hold, whether as a result of our own error or the malfeasance or errors of others, could harm our reputation or give rise to legal liabilities, leading to lower revenues, increased costs and other material adverse effects on our business and results of operations. Further, a cybersecurity incident could lead to a loss of commercially sensitive data, a loss of data integrity within our systems or loss of financial assets through fraud. A cyber-attack or serious uncured failure in our systems could result in an inability to deliver service to our customers. Although such disruptions and failures have not been material to date, we cannot guarantee that they will not be material in the future.
The security measures we employ to protect our systems and those employed by our third-party vendors may not detect or prevent all attempts to hack our systems, industrial espionage, man-in-the-middle and denial-of-service attacks, viruses, malicious software, employee error or malfeasance, phishing attacks, security breaches, disruptions during the process of upgrading or replacing computer software or hardware or integrating systems of acquired businesses or other attacks, and similar disruptions that may jeopardize the security of information stored in or transmitted by the sites, networks and systems that we rely on or otherwise maintain, which include cloud-based networks and data center storage. Cyber threats are constantly evolving, especially given the advances in, and the rise in the use of, AI, thereby increasing the difficulty of preventing, detecting and successfully defending against them. While we are continuously developing and enhancing our controls, processes, and practices designed to protect our systems, computers, software, data and networks from attack, damage, or unauthorized access, we may not be able to anticipate or combat attacks until after they have been launched. If any of these breaches of security occur or are anticipated in the future, we could be required to expend additional capital and other resources, including costs to deploy additional personnel and protection technologies, train employees and engage third-party experts and consultants. Our response to attacks, and our investments in our technology and our controls, processes and practices, may not be sufficient to shield us from significant losses or liability. Further, given the increasing sophistication of bad actors and complexity of the techniques used to obtain unauthorized access or disable systems, a breach or attack could potentially persist for
32
Table of Contents
an extended period of time before being detected. As a result, we may not be able to anticipate the attack or respond adequately or on a timely basis, and the extent of a particular incident, and the steps that we may need to take to investigate the incident, may not be immediately clear. It could take a significant amount of time before an investigation can be completed and full, reliable information about the incident becomes known. During an investigation, it is possible we may not necessarily know the extent of the harm or how to remediate it, which could further adversely impact us, and new regulations could result in us being required to disclose information about an incident before it has been mitigated or resolved, or even fully investigated. In addition, we may be required to accelerate disclosure due to contractual obligations with customers and other parties. Certain of our software applications are also hosted by third parties who provide outsourced administrative functions, which may increase the risk of a cybersecurity incident. Any compromise or breach of our systems could result in adverse publicity, harm our reputation, lead to claims against us and affect our relationships with our customers and employees, any of which could have a material adverse effect on our business. Although we maintain insurance coverage for various cybersecurity risks, there can be no guarantee that all costs or losses incurred will be fully insured. In addition, as security threats continue to evolve, we may need to invest additional resources to protect the security of our systems or to comply with privacy, data security, cybersecurity and data protection laws applicable to our business.
Failure to comply with data privacy and protection laws and regulations could subject us to legal liability and adversely affect our reputation and our financial performance.
We collect, use, process and store proprietary information and personal, sensitive, or confidential data relating to our business, customers, and employees. Privacy laws and similar regulations in many jurisdictions where we do business require that we take significant steps to safeguard that information, and these laws and regulations continue to evolve. New laws, including in relation to the use of AI, may add a broad array of requirements on how we handle or use information, increase our compliance obligations and impose new and greater monetary fines for privacy violations. For example, the General Data Protection Regulation (Regulation (EU) 2016/679), as it forms part of the law of the United Kingdom by virtue of the European Union (Withdrawal) Act 2018, imposes stringent data protection requirements and provides for significant penalties. In addition, in the United States, a growing number of states have enacted different laws regarding personal information and privacy that impose significant new requirements on consumer personal information. For example, the California Consumer Privacy Act gives California consumers expanded privacy rights and protections and provides for civil penalties for violations and a private right of action for data breaches. Other countries in which we operate have also proposed or adopted their own data protection legislation. Non-compliance with applicable data privacy and protection laws and regulations, including by third parties on which we rely for our information technology platforms, could lead to lower revenues, increased costs (including fines, which could be significant) and other material adverse effects on our results of operations. Failure to comply with such laws and regulations may also result in government enforcement actions (which could include substantial civil and/or criminal penalties) and private litigation, which could adversely affect our reputation and results of operations. Moreover, an expanding set of AI laws, including the European Union’s AI Act (Regulation (EU) 2024/1689), and emergent U.S. state laws, such as the Colorado Artificial Intelligence Act, will add compliance requirements to the implementation of AI tools that will raise compliance costs and create penalties for nonconformity.
Although we monitor and assess the impact of data privacy and protection laws and regulations, these laws and regulations are broad in scope, complex, and subject to evolving interpretations and increasing enforcement, and may require substantial costs to monitor and implement. Moreover, certain new and existing data privacy laws and regulations diverge and conflict with each other in certain respects, which makes compliance increasingly difficult. Complying with new and existing data privacy laws and regulations has in the past required, and could in the future require, us to incur substantial expenses or require us to change our business practices, either of which could harm our business. As regulators have become increasingly focused on information security, data collection and use and privacy, we may be required to devote significant additional
33
Table of Contents
resources to modify and enhance our information security controls and to identify and remediate vulnerabilities, which could adversely impact our results of operations and profitability.
Climate change and legal or regulatory responses thereto may have a long-term negative impact on our business and results of operations.
There is increasing concern that a gradual increase in global average temperatures due to the concentration of carbon dioxide and other greenhouse gases in the atmosphere will cause significant change in weather patterns around the globe and increase the frequency and severity of natural disasters. Increased frequency or duration of extreme weather conditions could impact our business and the demand for our equipment and services. In addition, in an effort to combat climate change, our customers may require our rental equipment to meet certain standards for low or zero greenhouse gas emissions. If we are unable to meet such standards and the expectations of our customers, our business and results of operations could be materially adversely affected.
In addition, Congress and other legislative and regulatory authorities in the United States and internationally have considered, and likely will continue to consider, numerous measures related to climate change, greenhouse gas emissions and other laws and regulations affecting our end markets, such as oil, gas and other natural resource extraction. Should such laws and regulations become effective, demand for our services could be affected, our fleet and/or other costs could increase, and our business could be materially adversely affected.
Regulators’ and stakeholders’ requirements and expectations on social and sustainability-related topics continue to evolve, and our ability to meet these requirements and expectations may have a material adverse impact on our results of operations.
Social and sustainability-related topics, such as diversity and climate change, as well as companies’ actions and initiatives on environmental, social and governance (ESG) issues, have received significant attention from a wide range of stakeholders. The federal government, states and certain other countries and regions have adopted or are considering legislation, regulation or policies on these topics, including in relation to diversity, equity and inclusion programs, the imposition of caps or taxes on greenhouse gas emissions from certain sectors or facility categories, and disclosure of corporate greenhouse gas emissions. In addition, certain investors and other stakeholders have expressed negative sentiments regarding corporate ESG initiatives. Our practices and efforts in these areas may not align with the expectations of all stakeholders, which could negatively affect our relationships with certain stakeholders.
Additionally, we may be subject to emerging and evolving regulatory requirements and frameworks regarding ESG matters, including potential new or revised disclosure rules. The ultimate scope of these regulations may change as they are finalized, and they may not be uniform across jurisdictions. Compliance with such laws, regulations or policies could, among other things, increase the costs of operating our businesses, reduce the demand for our products and services and impact the prices we charge our customers, any or all of which could adversely affect our results of operations. We have mechanisms in place to support compliance with applicable ESG matters and disclosures, as well as applicable self-regulatory industry codes by region that we have committed to follow. In addition, policymakers in some jurisdictions have adopted or proposed laws, regulations and policies that diverge from, or potentially conflict with, those in other jurisdictions. Failure to comply with any legislation, regulation or policy, including as a result of making good faith interpretations that may differ from those taken by enforcement authorities in relevant jurisdictions, could potentially result in substantial fines, criminal sanctions, reputational harm or operational changes. Moreover, our customers, stockholders, employees and other stakeholders have diverse expectations, demands and perspectives on these topics, which are continuing to evolve. While we have mechanisms in place to monitor stakeholder expectations and gather stakeholder feedback, we may not be able to meet the diverse expectations and demands of all of our stakeholders, which could result in adverse publicity, harm our reputation, lead to claims against us and affect our relationships with our customers and employees, and subject us to legal and operational risks, any of which could have a material adverse effect on our business.
34
Table of Contents
The impacts of a global pandemic and similar health concerns could have a significant impact on worldwide economic conditions and a material adverse effect on our operations and financial results.
The outbreak of a widespread public health crisis, including an epidemic or pandemic, could result in an economic downturn, affecting the supply and/or demand for our equipment. Any quarantines, labor shortages or other disruptions to us, our suppliers, or our customers would likely adversely impact our sales and operating results. The extent of any additional impact from a pandemic on our operational and financial performance and liquidity will depend on various developments, including the duration and spread of the outbreak, governmental limitations on business operations generally, and the resulting impact on customers, employees, and suppliers, vendors and distribution partners. As we cannot predict the potential future impact of the duration or scope of a global pandemic or similar health concerns, any resulting future financial impact cannot be reasonably estimated. In addition, to the extent that a global pandemic or similar health concerns adversely affect our results of operations or financial condition, it may also heighten the other risks described herein.
We have not yet completed our evaluation of our internal control over financial reporting in compliance with Section 404 of the Sarbanes-Oxley Act. If we fail to maintain an effective system of internal controls, or if we identify a material weakness in the future, we may not be able to accurately report our financial results or prevent fraud and, as a result, shareholders could lose confidence in our financial and other public reporting, which would harm our business and the trading price of the Sunbelt Rentals Common Stock and may cause other increases in operating costs.
We are not currently required to assess, or report on the effectiveness of, our internal control over financial reporting for purposes of Section 404 of the Sarbanes-Oxley Act. As a result of becoming a public reporting company in the United States, we will be required to comply with the internal control evaluation and certification requirements of Section 404 of the Sarbanes-Oxley Act by the conclusion of our fiscal year ending April 30, 2027. We have not yet completed our evaluation as to whether our current internal controls meet the requirements of Section 404. We may not be compliant and may not be able to meet the Section 404 requirements in a timely manner. If it is determined that we are not in compliance with Section 404, we may be required to implement new internal control procedures and re-evaluate our financial reporting. We may also experience higher than anticipated operating expenses during the implementation of these changes and thereafter, should we need to hire additional qualified personnel to help us become compliant with Section 404. If we fail, for any reason, to implement these changes effectively or efficiently, such failure could harm our reputation, operations, financial reporting or financial results and could result in our conclusion that our internal controls are not effective.
If we identify a material weakness in our internal controls in the future, our ability to meet our reporting obligations and the trading price of the Sunbelt Rentals Common Stock could be negatively affected. A material weakness is a deficiency, or a combination of deficiencies, in internal control over financial reporting, such that a reasonable possibility exists that a material misstatement of our annual or interim financial statements will not be prevented or detected on a timely basis. Accordingly, a material weakness increases the risk that the financial information we report contains material errors. Any system of internal controls, however well-designed and operated, is based in part on certain assumptions and can provide only reasonable, not absolute, assurances that the objectives of the system are met. If we cannot conclude that we have effective internal control over our financial reporting, investors could lose confidence in the reliability of our financial statements, which could lead to a decline in the trading price of the Sunbelt Rentals Common Stock. Failure to comply with reporting requirements could also subject us to sanctions and/or investigations by the NYSE or the SEC or other regulatory authorities.
Effective internal controls are necessary for us to provide reliable financial reports and prevent fraud, together with adequate disclosure controls and procedures. Any failure to implement required new or improved controls, or difficulties encountered in their implementation, could cause us to fail to meet our reporting obligations. In addition, any testing by us, as and when required, conducted in connection with Section 404 of the Sarbanes-Oxley Act, or subsequent testing by our independent registered public accounting firm, as and when required, may reveal deficiencies in our internal controls that are deemed to be material weaknesses or that may
35
Table of Contents
require prospective or retroactive changes to our financial statements or identify other areas for further attention or improvement. Inferior internal controls could also cause investors to lose confidence in our reported financial information, which could have a negative effect on the trading price of the Sunbelt Rentals Common Stock.
Risks Related to the Redomiciliation and U.S. Listing
We may not realize all of the benefits of the Redomiciliation and U.S. Listing, or such benefits may take longer than anticipated or may be lower than estimated.
We are implementing the Redomiciliation and U.S. Listing because we believe that it will enable alignment of the primary listing location of Sunbelt Rentals with the majority of our business activity, leadership team and employee base; increased exposure to U.S. investors; a greater average daily trading volume; improvement of our profile through rebranding as Sunbelt Rentals; simplifying common stock ownership for our employee base of the Company and expanded access to the recruitment and retention of U.S. talent; and potential inclusion in U.S. equity indices. However, the anticipated benefits of the Redomiciliation and U.S. Listing may not be realized fully, or at all, or may take longer to realize than expected. Further, the costs of achieving these benefits may be greater than expected. Any such risks may result in our operating costs being greater than anticipated and may reduce the net benefits of the Redomiciliation and U.S. Listing. In addition, there may be some negative impacts on our business as a result of the Redomiciliation and U.S. Listing, and the value of the Sunbelt Rentals Common Stock may be materially adversely affected.
We will incur certain costs and expenses relating to the implementation of the Redomiciliation and certain internal reorganization transactions that are expected to be undertaken in connection with the implementation of the Redomiciliation in order to optimize the Company’s operating structure, as well as costs relating to the U.S Listing and ongoing reporting obligations as a U.S. listed company. These costs and expenses may include tax liabilities for the Company calculated by reference to facts and circumstances that are currently uncertain. Nevertheless, they are not expected to be significant in the context of the anticipated benefits of the Redomiciliation.
Our stockholders’ rights under Delaware law will differ from their rights under English law. Moreover, the U.K. Takeover Code, which currently applies to Ashtead, will not apply to any takeover offer for Sunbelt Rentals.
Upon effectiveness of the Redomiciliation, your rights as a stockholder of Sunbelt Rentals will be governed by Delaware law and the Sunbelt Rentals Certificate of Incorporation and Sunbelt Rentals Amended and Restated Bylaws (the Sunbelt Rentals Bylaws and, together with the Sunbelt Rentals Certificate of Incorporation, the Sunbelt Rentals Organizational Documents). The Sunbelt Rentals Organizational Documents and Delaware law contain provisions that differ in certain respects from those in the existing articles of association of Ashtead (the Ashtead Articles) and English law and, therefore, some of your rights as a stockholder will change. For instance, Delaware law provides that a certificate of incorporation may contain a provision eliminating or limiting the personal liability of directors and officers in certain circumstances and, in accordance therewith, under the Sunbelt Rentals Certificate of Incorporation, the directors and certain officers will not be personally liable to Sunbelt Rentals or any of its stockholders for monetary damages for breach of fiduciary duty as a director or officer to the fullest extent permitted by the Delaware General Corporation Law (the DGCL). Currently the DGCL does not permit exculpation for: (i) a director or officer for any breach of the director’s or officer’s duty of loyalty to Sunbelt Rentals or its stockholders; (ii) a director or officer for acts or omissions not in good faith or which involve intentional misconduct or a knowing violation of law; (iii) a director for unlawful payment of dividends or unlawful stock repurchases or redemptions, as provided under Section 174 of the DGCL; (iv) a director or officer for any transaction from which the director or officer derived an improper personal benefit; or (v) an officer in any action by or in the right of the corporation. For a further description of your rights following the Redomiciliation and how they may differ from your current rights, please see “Comparison of Corporate Governance and Stockholder Rights” under Item 11 (Description of Registrant’s Securities to be Registered). You are encouraged to read each of the Sunbelt Rentals Certificate of Incorporation and the Sunbelt Rentals Bylaws, which are attached hereto as Exhibit 3.1 and Exhibit 3.2, respectively.
36
Table of Contents
Moreover, the U.K. Takeover Code, which currently applies to Ashtead, will not apply to any takeover offer for Sunbelt Rentals due to its incorporation in Delaware, meaning that, upon effectiveness of the Redomiciliation, stockholders of Sunbelt Rentals will no longer be afforded the specific protections provided by the U.K. Takeover Code. This includes the requirement for a mandatory cash offer to be made if either:
| • | a person acquires an interest in shares which, when taken together with the shares in which persons acting in concert with it are interested, increases the percentage of shares carrying voting rights in which it is interested to 30% or more; or |
| • | a person, together with persons acting in concert with it, is interested in shares which in the aggregate carry not less than 30% of the voting rights of a company but does not hold shares carrying more than 50% of such voting rights and such person, or any person acting in concert with it, acquires an interest in any other shares which increases the percentage of shares carrying voting rights in which it is interested. |
The price of Sunbelt Rentals Common Stock may be negatively impacted, and stockholders of Sunbelt Rentals may suffer losses, as a result of the different rights afforded to stockholders of Sunbelt Rentals following effectiveness of the Redomiciliation and the loss of the protections provided by the U.K. Takeover Code.
Provisions in the Sunbelt Rentals Organizational Documents and under Delaware law could discourage another company from acquiring Sunbelt Rentals and may prevent attempts by Sunbelt Rentals stockholders to replace or remove its current management.
Provisions in the Sunbelt Rentals Organizational Documents may discourage, delay or prevent a merger, acquisition or other change in control of Sunbelt Rentals that certain stockholders may consider favorable, including transactions in which stockholders might otherwise receive a premium for their stock. These provisions could also limit the price that investors might be willing to pay in the future for Sunbelt Rentals Common Stock, thereby depressing the market price of Sunbelt Rentals Common Stock. In addition, these provisions may frustrate or prevent any attempts by stockholders of Sunbelt Rentals to replace or remove its current management by making it more difficult for stockholders to replace members of the board of directors of Sunbelt Rentals (the Sunbelt Rentals Board). Among other things, these provisions:
| • | provide the Sunbelt Rentals Board the right to issue one or more series of preferred stock of Sunbelt Rentals (Sunbelt Rentals Preferred Stock) and to determine the price and other terms of such preferred stock, including preferences and voting rights, without stockholder approval; |
| • | authorize a number of shares of Sunbelt Rentals Common Stock that are not yet issued, which would allow the Sunbelt Rentals Board to issue stock to persons friendly to current management without offering pre-emptive rights to existing stockholders; |
| • | permit the Sunbelt Rentals Board to amend the Sunbelt Rentals Bylaws, which may allow the Sunbelt Rentals Board to take additional actions to prevent an unsolicited takeover and inhibit the ability of an acquirer to amend the bylaws to facilitate an unsolicited takeover attempt; |
| • | prohibit stockholders from taking action by written consent; |
| • | only permit stockholders who collectively own stock representing, in the aggregate, at least 25% of the voting power of the then outstanding shares to call a special meeting; |
| • | do not permit cumulative voting in the election of directors, which limits the ability of minority stockholders to elect director candidates; |
| • | provide the Sunbelt Rentals Board with the sole authority to determine the number of directors of the Sunbelt Rentals Board and to fill vacancies on the Sunbelt Rentals Board (whether resulting from an increase in the authorized number of directors or otherwise); and |
37
Table of Contents
| • | establish advance notice and other requirements for nominations of candidates for election to the Sunbelt Rentals Board or for proposing matters that can be acted on by stockholders at the annual or special meetings of stockholders. |
As a Delaware corporation, Sunbelt Rentals will be subject to provisions of Delaware law, including Section 203 of the DGCL. Section 203 of the DGCL provides (in general) that, unless certain conditions have been met, Sunbelt Rentals may not engage in a business combination with an interested stockholder (generally defined as a stockholder of Sunbelt Rentals, together with his or her affiliates or associates, who owns more than 15% of the voting stock of Sunbelt Rentals) for a period of three years after the time of the transaction in which the person became an interested stockholder. The prohibition on business combinations with interested stockholders does not apply in some cases, including if: (1) the Sunbelt Rentals Board, prior to the time of the transaction in which the stockholder became an interested stockholder, approves the business combination or the transaction in which the stockholder becomes an interested stockholder; (2) upon consummation of the transaction that resulted in the stockholder becoming an interested stockholder, the interested stockholder owned at least 85% of the voting stock (excluding stock owned by certain persons) of Sunbelt Rentals outstanding at the time the transaction commenced; or (3) at or after the time at which the person became an interested stockholder, the Sunbelt Rentals Board and the holders of at least two-thirds of the outstanding voting stock not owned by the interested stockholder approve, at an annual or special meeting of stockholders, and not by written consent, the business combination. Any provision of the Sunbelt Rentals Organizational Documents or Delaware law that has the effect of delaying or deterring a change in control could limit the opportunity for Sunbelt Rentals stockholders to receive a premium for their Sunbelt Rentals Common Stock and affect the price that some investors are willing to pay for the Sunbelt Rentals Common Stock.
The Sunbelt Rentals Certificate of Incorporation provides that the Delaware Court of Chancery will be the exclusive forum for substantially all disputes between Sunbelt Rentals and its stockholders, which could limit stockholders’ ability to obtain a favorable judicial forum for disputes with Sunbelt Rentals or its directors, officers, employees, agents or stockholders.
The Sunbelt Rentals Certificate of Incorporation provides that, subject to certain exceptions, the Delaware Court of Chancery will, to the fullest extent permitted by law, be the sole and exclusive forum for (i) any derivative action or proceeding brought on behalf of Sunbelt Rentals, (ii) any action asserting a claim of breach of a duty (including any fiduciary duty) by, or other wrongdoing by, any current or former director, officer, employee, agent or stockholder of Sunbelt Rentals to Sunbelt Rentals or the stockholders of Sunbelt Rentals, (iii) any action asserting a claim against Sunbelt Rentals or any current or former director, officer, employee, agent or stockholder of Sunbelt Rentals arising out of or relating to any provision of the DGCL, the Sunbelt Rentals Certificate of Incorporation or the Sunbelt Rentals Bylaws, (iv) any action to interpret, apply, enforce or determine the validity of the Sunbelt Rentals Certificate of Incorporation or the Sunbelt Rentals Bylaws, (v) any action asserting a claim against Sunbelt Rentals or any current or former director, officer, employee, agent or stockholder of Sunbelt Rentals governed by the internal affairs doctrine, (vi) any action asserting an “internal corporate claim” as that term is defined in Section 115 of the DGCL or (vii) any action as to which the DGCL confers jurisdiction on the Delaware Court of Chancery. In addition, to prevent having to litigate claims in multiple jurisdictions and the threat of inconsistent or contrary rulings by different courts, among other considerations, the Sunbelt Rentals Certificate of Incorporation provides that, unless Sunbelt Rentals consents in writing to the selection of an alternative forum, to the fullest extent permitted by law, the federal district courts of the United States will be the sole and exclusive forum for resolving any complaint asserting a cause of action arising under the Securities Act against Sunbelt Rentals or any director, officer, employee or agent of Sunbelt Rentals. However, Section 22 of the Securities Act creates concurrent jurisdiction for federal and state courts over all suits brought to enforce any duty or liability created by the Securities Act or the rules and regulations thereunder. Accordingly, both state and federal courts have jurisdiction to entertain such claims. Due to the concurrent jurisdiction for federal and state courts created by Section 22 of the Securities Act over all suits brought to enforce any duty or liability created by the Securities Act or the rules and regulations promulgated thereunder, there is uncertainty as to whether a court would enforce the exclusive forum provision.
38
Table of Contents
These exclusive forum provisions may limit a stockholder’s ability to bring a claim in a judicial forum that it finds favorable for disputes with Sunbelt Rentals or its directors, officers, employees, agents or stockholders and this limitation may have the effect of discouraging lawsuits or make Sunbelt Rentals securities less attractive to investors. For example, stockholders who bring a claim in the Delaware Court of Chancery could face additional litigation costs in pursuing any such claim, particularly if they do not reside in or near the State of Delaware. The Delaware Court of Chancery may also reach different judgments or results than would other courts, including courts where a stockholder considering an action may be located or would otherwise choose to bring the action, and such judgments or results may be more favorable to Sunbelt Rentals than to its stockholders. Further, while the Delaware courts have determined that such choice of forum provisions are facially valid, a stockholder may nevertheless seek to bring such a claim arising under the Securities Act against Sunbelt Rentals, its directors, officers, employees, agents or stockholders in a venue other than in the federal district courts of the United States. In such instance, Sunbelt Rentals would expect to vigorously assert the validity and enforceability of the exclusive forum provisions of the Sunbelt Rentals Certificate of Incorporation. This may require significant additional costs associated with resolving such action in other jurisdictions and Sunbelt Rentals cannot assure you that the provisions will be enforced by a court in those other jurisdictions. If a court were to find the exclusive forum provisions in the Sunbelt Rentals Certificate of Incorporation to be inapplicable or unenforceable in an action, Sunbelt Rentals may incur further significant additional costs associated with resolving the dispute in other jurisdictions, all of which could harm our business.
The Sunbelt Rentals Certificate of Incorporation provides that any person purchasing or otherwise acquiring or holding any interest in Sunbelt Rentals Common Stock shall be deemed to have notice of and to have consented to the exclusive forum provisions described above. However, these exclusive forum provisions may not apply to suits brought to enforce a duty or liability vested in the exclusive jurisdiction of a court or forum other than the Delaware Court of Chancery, such as those created by the Exchange Act, or any other claim for which the federal courts have exclusive jurisdiction.
If the Redomiciliation fails to qualify as a “reorganization” within the meaning of Section 368(a) of the Internal Revenue Code or tax-free exchange within the meaning of Section 351 of the Internal Revenue Code, U.S. Holders (as defined in “Material U.S. Federal Income Tax Considerations—U.S. Holders” under Item 11 (Description of Registrant’s Securities to be Registered)) may recognize taxable gain as a result of the Redomiciliation.
The Redomiciliation is intended to qualify as a “reorganization” within the meaning of Section 368(a) of the U.S. Internal Revenue Code of 1986, as amended (the Internal Revenue Code), a tax-free exchange within the meaning of Section 351 of the Internal Revenue Code, or both (collectively, the Intended Tax Treatment), and we intend to file tax returns consistent with this Intended Tax Treatment. Our position is not binding on the Internal Revenue Service (the IRS) or the courts, and we do not intend to request a ruling from the IRS with respect to the Redomiciliation. Accordingly, there can be no assurance that the IRS will not challenge the Intended Tax Treatment or that a court will not sustain such a challenge. If the IRS were to be successful in any such contention, or if for any other reason the Intended Tax Treatment were to not be respected for U.S. federal income tax purposes, the Redomiciliation could be a taxable event to the U.S. Holders. Stockholders are urged to consult with their own tax advisors with respect to the tax consequences of the Redomiciliation.
Following the Redomiciliation, Non-U.S. Holders (as defined in “Material U.S. Federal Income Tax Considerations—Non-U.S. Holders” under Item 11 (Description of Registrant’s Securities to be Registered)) may be subject to U.S. federal income tax.
In general, any distributions made to a Non-U.S. Holder with respect to Sunbelt Rentals Common Stock, to the extent paid out of Sunbelt Rentals’ current or accumulated earnings and profits (as determined under U.S. federal income tax principles), will constitute dividends for U.S. federal income tax purposes and, provided such dividends are not effectively connected with such Non-U.S. Holder’s conduct of a trade or business within the United States (and, if required by an applicable income tax treaty, attributable to a U.S. permanent establishment or fixed base maintained by such Non-U.S. Holder), will be subject to withholding tax from the gross amount of
39
Table of Contents
the dividend at a rate of 30%, unless such Non-U.S. Holder is eligible for a reduced rate of withholding tax under an applicable income tax treaty and provides proper certification of its eligibility for such reduced rate (usually on an IRS Form W-8BEN or W-8BEN-E, as applicable). Payments of dividends on Sunbelt Rentals Common Stock to applicable persons could be subject to increased rates of U.S. federal income tax and withholding tax as a result of a change in law. Dividends paid by Sunbelt Rentals to a Non-U.S. Holder that are effectively connected with such Non-U.S. Holder’s conduct of a trade or business within the U.S. (and, if required by an applicable income tax treaty, attributable to a U.S. permanent establishment or fixed base maintained by such Non-U.S. Holder) will generally not be subject to U.S. federal withholding tax, provided such Non-U.S. Holder complies with certain certification and disclosure requirements (usually by providing an IRS Form W-8ECI). Instead, such dividends will generally be subject to U.S. federal income tax, net of certain deductions, at the same graduated individual or corporate rates applicable to U.S. Holders. If the Non-U.S. Holder is a corporation, dividends that are effectively connected income may also be subject to a “branch profits tax” at a rate of 30% (or such lower rate as may be specified by an applicable income tax treaty). For more information about U.S. federal income tax considerations with respect to such matters, see the section entitled “Material U.S. Federal Income Tax Considerations” under Item 11 (Description of Registrant’s Securities to be Registered).
The effective tax rate of Sunbelt Rentals may increase in the future, including as a result of the Redomiciliation.
Following the Redomiciliation, the income of Sunbelt Rentals will be subject to U.S. federal income tax, as well as income tax in other jurisdictions. Currently applicable income tax laws, regulations, treaties and judicial and administrative interpretations of these laws, regulations and treaties in the United States and other jurisdictions may cause Sunbelt Rentals’ effective tax rate to fluctuate significantly beyond our current projections. In light of these factors, there can be no assurance that Sunbelt Rentals’ effective tax rate will not be materially affected in future periods.
Moreover, U.S. tax laws significantly limit Sunbelt Rentals’ ability to redomicile outside of the United States once the Redomiciliation has been consummated. Accordingly, if Sunbelt Rentals’ effective tax rate were to increase significantly as a result of the Redomiciliation, the business and financial performance of Sunbelt Rentals could be adversely affected.
If the Redomiciliation fails to qualify for “reorganisation of share capital” treatment pursuant to Section 136 of the Taxation of Chargeable Gains Act 1992, U.K. Holders (as defined in “Material U.K. Tax Considerations” under Item 11 (Description of Registrant’s Securities to be Registered)) may recognize taxable gain as a result of the Redomiciliation.
We intend for the Redomiciliation to qualify as a “reorganisation of share capital” pursuant to Section 136 of the Taxation of Chargeable Gains Act 1992 for the purposes of U.K. CGT (as defined in “Material U.K. Tax Considerations” under Item 11 (Description of Registrant’s Securities to be Registered)). If a shareholder alone, or together with persons connected with him or her, holds more than 5% of, or any class of, the shares in or debentures of Ashtead, such shareholder will be eligible for the above treatment only if the Redomiciliation is effected for bona fide commercial reasons and does not form part of a scheme or arrangement of which the main purpose, or one of the main purposes, is avoidance of liability to U.K. CGT. If these conditions are not met, then such shareholders will be treated as receiving Sunbelt Rentals Common Stock in consideration for the transfer of his or her Ashtead Shares, which may, depending on the individual circumstances, give rise to a chargeable gain or allowable loss for U.K. CGT purposes. No application has been made to HM Revenue & Customs (HMRC) under Section 138 Taxation of Chargeable Gains Act 1992 for clearance that these conditions will be met. Shareholders are urged to consult with their own tax advisors with respect to the tax consequences of the Redomiciliation. For more information about the U.K. tax considerations with respect to such matters, see the section entitled “Material U.K. Tax Considerations” under Item 11 (Description of Registrant’s Securities to be Registered).
40
Table of Contents
Non-U.S. Holders and non-U.K. Holders may recognize taxable gain as a result of the Redomiciliation.
Sunbelt Rentals has not analyzed the impact of the Redomiciliation in all jurisdictions, and it is possible that the Redomiciliation would be viewed as taxable to shareholders in jurisdictions other than the United States and the United Kingdom. Shareholders are urged to consult with their own tax advisors with respect to their specific tax consequences of the Redomiciliation.
Risks Related to the Ownership of Sunbelt Rentals Common Stock
An active and liquid market for the Sunbelt Rentals Common Stock may not develop or be sustained.
Prior to the effectiveness of this Registration Statement, the Ashtead Shares have traded only on the LSE, and there has been no established trading market for the Sunbelt Rentals Common Stock in the United States. We have applied to list the Sunbelt Rentals Common Stock on the NYSE. Active, liquid trading markets generally result in lower bid ask spreads and more efficient execution of buy and sell orders for market participants. If an active trading market for the Sunbelt Rentals Common Stock does not develop in the United States, the stock price may be more volatile and it may be more difficult and time consuming to complete a transaction in Sunbelt Rentals Common Stock, which could have an adverse effect on the realized price of the Sunbelt Rentals Common Stock.
When the Sunbelt Rentals Common Stock commences trading on the NYSE, we expect the initial listing price to be set by designated market makers and will likely be based on the current trading price of the Ashtead Shares on the LSE. However, we cannot predict the price at which the Sunbelt Rentals Common Stock will trade and cannot guarantee that investors will be able to sell their shares at any particular price. There is no assurance that an active and liquid trading market for the Sunbelt Rentals Common Stock will develop or be sustained in the United States or maintained in the United Kingdom.
The obligations associated with being a public company in the United States will require significant resources and management attention and may increase our legal and financial compliance costs, particularly as changing laws, regulations and standards are creating uncertainty for U.S. public companies.
Subject to the consummation of the U.S. Listing, we will be subject to the reporting requirements of the Exchange Act and the Sarbanes-Oxley Act of 2002 (the Sarbanes-Oxley Act), the listing requirements of the NYSE, and other applicable securities rules and regulations. The Exchange Act requires that we file annual, quarterly and other reports with respect to our business, financial condition and results of operations. The Sarbanes-Oxley Act requires, among other things, that we establish and maintain effective internal controls and procedures for financial reporting as well as effective disclosure controls with respect to our public disclosures and filings with the SEC. As a result, the Company will incur significant legal, accounting and other expenses that it did not previously incur. Our entire management team and many of its other employees will need to devote substantial time to compliance and may not effectively or efficiently manage its transition into a public company. Moreover, because the Company will be listed on the LSE, we will be subject to regulation both in the United States and in the United Kingdom, and may from time to time need to reconcile opposing regulatory requirements going forward.
The establishment and maintenance of the corporate infrastructure demanded of a U.S. public company may, in certain circumstances, divert management’s attention from implementing our strategy to drive profitable growth, which could prevent us from improving our business, financial condition and results of operations. We have made, and will continue to make, changes to our internal controls and procedures for financial reporting and accounting systems in order to meet our reporting obligations as a public company in the United States with domestic issuer status. However, the measures we take may not be sufficient to satisfy these obligations. In addition, compliance with these rules and regulations have increased our legal and financial compliance costs and have made some activities more time-consuming and costly. These additional obligations may have a material adverse impact on our business, financial condition, results of operations and cash flow.
41
Table of Contents
In addition, changing laws, regulations and standards relating to corporate governance, ESG matters and public disclosure are creating uncertainty for public companies in the United States, increasing legal and financial compliance costs and making some activities more time-consuming. These laws, regulations and standards are subject to varying interpretations, in many cases due to their lack of specificity and, as a result, their application in practice may evolve over time as new guidance is provided by regulatory and governing bodies. This could result in continuing uncertainty regarding compliance matters and higher costs necessitated by ongoing revisions to disclosure and governance practices. We have invested, and expect to continue to invest, resources to comply with evolving laws, regulations and standards, and this investment may result in increased operating expenses and a diversion of management’s time and attention from sales-generating activities to compliance activities. If our efforts to comply with new laws, regulations and standards differ from the activities intended by regulatory or governing bodies due to ambiguities related to their application and practice, regulatory authorities may initiate legal proceedings against us and our business, financial condition, results of operations and cash flow could be adversely affected.
Following the consummation of the U.S. Listing, the price of the Sunbelt Rentals Common Stock may be subject to market price volatility and may decline disproportionately in response to developments that are unrelated to our operating performance.
Following the consummation of the U.S. Listing, the price of the Sunbelt Rentals Common Stock may initially or in the future be volatile and subject to wide fluctuations. The market price of the Sunbelt Rentals Common Stock may fluctuate as a result of a variety of factors including, but not limited to, general economic and political conditions, period to period variations in operating results, changes in net sales or net income estimates by us, industry participants or financial analysts, our failure to meet our stated guidance, our failure to comply with the rules under the Sarbanes-Oxley Act related to accounting controls and procedures, the discovery of material weaknesses and other deficiencies in our internal control and accounting procedures, and the other factors discussed in “—Risks Related to Our Business” above. If we are unable to assert that our internal control over financial reporting is effective, or if our independent registered public accounting firm is unable to express an opinion as to the effectiveness of our internal control over financial reporting, when required, investor confidence in us may be adversely affected and, as a result, the value of the Sunbelt Rentals Common Stock may decline.
Furthermore, while Sunbelt Rentals is expected to establish a listing on the LSE in addition to its listing on the NYSE, there may be volatility in our stock price as a result of the turnover in our stockholder base to the United States in connection with the U.S. Listing.
In addition, the market price of the Sunbelt Rentals Common Stock could also be adversely affected by developments unrelated to our operating performance, such as the operating and share price performance of other companies that investors may consider comparable to us, speculation about us in the press or the investment community, unfavorable press, strategic actions by competitors (including acquisitions and restructurings), changes in market conditions, regulatory changes, broader market volatility and movements and delay in our inclusion in North American indices. Any or all of these factors could result in material fluctuations in the market price of the Sunbelt Rentals Common Stock, which could result in investors losing some or all of their original investment.
Moreover, where the market price of a company’s stock has been volatile, the stockholders of such company may file securities class action litigation against that company based on various claims, such as securities fraud and other violations of securities laws. While we have not been a target of this type of litigation, we may be in the future. The defense and disposition of litigation of this type could result in substantial costs and divert resources and the time and attention of our management, which could materially and adversely affect our business or financial condition.
42
Table of Contents
The Sunbelt Rentals Common Stock is expected to be listed to trade on more than one stock exchange, and this may adversely affect liquidity in each market for the Sunbelt Rentals Common Stock and result in price variations between the two exchanges.
Following the consummation of the U.S. Listing, the Sunbelt Rentals Common Stock is expected to be traded on both the NYSE (trading in U.S. dollars) and the LSE (trading in British pounds). Dual listing may result in price variations between the exchanges due to a number of factors. In addition, the exchanges are open for trade in different time zones, at different times of the day, and the two exchanges also have differing holiday schedules. Differences in the trading schedules, as well as volatility in the exchange rate of the two currencies, among other factors, may result in different trading prices for the Sunbelt Rentals Common Stock on the two exchanges.
Any shareholder whose principal currency is not the U.S. dollar will be subject to exchange rate fluctuations.
The Sunbelt Rentals Common Stock that will trade on the NYSE will be traded in U.S. dollars, and any cash dividends or other distributions to be declared in respect of them, if any, will be denominated in, U.S. dollars. Shareholders whose principal currency is not the U.S. dollar will thus be exposed to foreign currency exchange rate risk. Any depreciation of the U.S. dollar in relation to such foreign currency would reduce the value of the Sunbelt Rentals Common Stock held by such shareholders, whereas any appreciation of the U.S. dollar would increase their value in foreign currency terms.
If securities or industry analysts do not publish research or publish inaccurate or unfavorable research about our business, our share price and trading volume could decline.
The trading market for the Sunbelt Rentals Common Stock will depend in part on the research and reports that securities or industry analysts publish about us or our business. If one or more of the analysts who cover us downgrade our rating, lower our price target, or publish inaccurate or unfavorable research about our business, our share price could decline. If one or more of these analysts cease coverage of our company or fail to publish reports on our company regularly, demand for the Sunbelt Rentals Common Stock could decrease, which might cause our share price and trading volume to decline.
We may not pay dividends or undertake share repurchases in the future. Our ability to pay dividends, undertake share repurchases or make other returns of capital in the future depends, among other things, on our financial performance.
There can be no guarantee that our historical performance will be repeated in the future, particularly given the competitive nature of the industry in which we operate, and our revenue, profit and cash flow may significantly underperform market expectations. If our cash flow underperforms market expectations, then our capacity to pay a dividend, undertake share repurchases or make other returns of capital (including, without limitation, share repurchases) may be negatively impacted. Any decision to declare and pay dividends, undertake a share repurchase or to make other returns of capital will be made at the discretion of the Sunbelt Rentals Board and will depend on, among other things, applicable law, regulation, restrictions (if any) on the payment of dividends and/or capital returns in our financing arrangements, our financial position, retained earnings/profits, working capital requirements, finance costs, general economic conditions and other factors that the Sunbelt Rentals Board deems significant from time to time.
We are a holding company and depend on our subsidiaries for cash, including in order to pay dividends or undertake share repurchases.
We are a holding company and are dependent on earnings and distributions of funds from our operating subsidiaries for cash, including in order to pay any future dividends to our shareholders or to undertake share repurchases. Our future ability to pay dividends to our shareholders or to undertake share repurchases will
43
Table of Contents
depend on the ability of our subsidiaries to distribute profits or pay dividends to us, general economic conditions and other factors that the Sunbelt Rentals Board deems significant from time to time. See also “—The restrictive covenants associated with our debt may limit our ability to operate our business and could prohibit us from pursuing opportunities which would be beneficial to our stockholders” above.
| Item 2. | Financial Information. |
Management’s Discussion and Analysis of Financial Condition and Results of Operations
The following discussion should be read in conjunction with, and is qualified in its entirety by reference to, our consolidated financial statements and related notes included elsewhere in this Registration Statement. This discussion and analysis contains forward-looking statements. These forward-looking statements are subject to risk, uncertainties and other factors that could cause our actual results to differ materially from those expressed or implied by the forward-looking statements. Factors that could cause or contribute to these differences include, but are not limited to, those discussed elsewhere in this Registration Statement. See in particular “Special Note Regarding Forward–Looking Statements” and Item 1A (Risk Factors).
We have historically conducted our business through Ashtead, and therefore, our historical consolidated financial statements included in this Registration Statement present the consolidated results of operations of Ashtead and its subsidiaries. Sunbelt Rentals was incorporated on February 12, 2025 to become the new parent holding company of Ashtead. Sunbelt Rentals is a company with nominal assets and no liabilities, contingencies or commitments, and it conducted no operations prior to the date of this Registration Statement and does not intend to conduct any operations prior to consummation of the Redomiciliation.
Overview
We believe we are one of the largest international equipment rental companies by rental revenue, with a network of 1,578 stores across North America and the United Kingdom as of October 31, 2025. We conduct our equipment rental operations under the name “Sunbelt Rentals.” We believe that Sunbelt Rentals is the second largest equipment rental business in North America and the largest equipment rental company in the United Kingdom, in each case, by rental revenue. In the six months ended October 31, 2025, we generated revenue of $5,763 million, operating income of $1,279 million and adjusted operating profit of $1,445 million, and in the fiscal year ended April 30, 2025, we generated revenue of $10,791 million, operating income of $2,499 million and adjusted operating profit of $2,615 million. See “—Key Financial Metrics—Non-GAAP Financial Measures” below for a definition and reconciliation of adjusted operating profit to the most directly comparable GAAP measures.
Our rental equipment fleet comprises an extensive range of construction, industrial and general equipment designed to meet broad, general-purpose jobsite needs, such as mobile elevating work platforms, skid steers, forklifts, excavators, lighting equipment and small general tools. This core equipment range is complemented by Specialty business lines, including power and HVAC, climate control, scaffold services, flooring solutions, pump solutions, trench safety, industrial tool, film and television, temporary structures, ground protection, temporary fencing, and temporary walls. The original (or “first”) cost of our rental equipment fleet as of October 31, 2025 was $18,924 million and as of April 30, 2025 was $18,567 million. As of the same dates, the average age of our serialized rental equipment, which consists of individual pieces of equipment linked to a specific serial number and constitutes the substantial majority of our fleet, was approximately 51 months and 49 months, respectively, weighted on an original cost basis.
Our customers range in size and scale from multinational businesses to well-established local contractors and individual do-it-yourselfers, and include construction and industrial customers, service, repair and facility management businesses, emergency response organizations, event organizers, as well as government entities, such as municipalities and specialist contractors.
We organize and manage our operations based on geography and product and service offering. We operate under two primary geographic regions, aligned with our North American activities and assets and our U.K.
44
Table of Contents
activities and assets, and have further divided our North American business operationally into “General Tool” and “Specialty”, reflecting the nature of our products and services, as well as our management structure. As such, our business is divided into three reportable operational segments:
| • | North America – General Tool, which encompasses a broad selection of general construction and industrial equipment available to customers primarily in the United States and Canada. In addition, unless specified herein or otherwise clear from the context, references to this segment also include our limited operations in the Bahamas; |
| • | North America – Specialty, which includes our product groups with comparatively low rental penetration in predominantly non-construction markets, available to customers in the United States and Canada; and |
| • | United Kingdom, which delivers a comprehensive range of General Tool and Specialty products and services to customers primarily located across the United Kingdom. In addition, unless specified herein or otherwise clear from the context, references to this segment also include our limited operations in Ireland, Germany and the Netherlands. |
In the six months ended October 31, 2025, 59.0% of our revenue was attributable to the North America – General Tool segment, 32.6% of our revenue was attributable to the North America – Specialty segment and 8.4% of our revenue was attributable to the United Kingdom segment. In the fiscal year ended April 30, 2025, 59.3% of our revenue was attributable to the North America – General Tool segment, 32.3% of our revenue was attributable to the North America – Specialty segment and 8.4% of our revenue was attributable to the United Kingdom segment.
Redomiciliation and U.S. Listing
On June 10, 2025, the shareholders of Ashtead (the Ashtead Shareholders) voted in favor of a reorganization to be implemented by means of a U.K. court-sanctioned scheme of arrangement under the U.K. Companies Act 2006 (the Scheme) pursuant to which Sunbelt Rentals will become the new parent holding company of Ashtead and the Sunbelt Rentals Common Stock will be admitted to trading on the NYSE, with an additional listing on the LSE, which is the historical trading venue for the Ashtead Shares. As a result of the Scheme, Ashtead Shareholders will, instead of owning Ashtead Shares, own Sunbelt Rentals Common Stock. Each Ashtead Shareholder will own the same number of Sunbelt Rentals Common Stock as the number of Ashtead Shares held at the time at which the record of the register of the Ashtead Shareholders is taken, which is expected to be 6.30 p.m. (London time) on the Scheme Effective Date (as defined below). The Redomiciliation and the U.S. Listing will not result in any changes in the day-to-day operations of our business, our strategy or our total issued share capital.
The Scheme will become effective once it has been sanctioned by the High Court of Justice in England and Wales (the Court) and, approximately three days later, a copy of the order by the Court sanctioning the Scheme has been delivered to the Registrar of Companies in England and Wales for registration (delivery will occur at the Scheme Effective Time on the Scheme Effective Date).
The Company’s directors will only take the steps necessary for the Scheme Effective Date to occur if each of the following conditions has been satisfied or (where applicable) waived:
| (a) | the formal processes have been put in place to delist the Ashtead Shares from the LSE; |
| (b) | the SEC has declared effective this Registration Statement; |
| (c) | the NYSE has agreed to admit the Sunbelt Rentals Common Stock for listing and not withdrawn its agreement prior to the Scheme Effective Time; and |
| (d) | the LSE has agreed to admit the Sunbelt Rentals Common Stock to the Equity Shares (International Commercial Companies Secondary Listings) Category of the Official List and to trading on the LSE’s main market for listed securities, and not withdrawn its agreement prior to the Scheme Effective Time. |
45
Table of Contents
The Scheme Effective Date is expected to occur on February 27, 2026. However, if the Scheme Effective Date for any reason does not occur before December 31, 2026 (or such later date that Ashtead and Sunbelt Rentals may agree and the Court may allow), the Scheme will lapse, in which event the Scheme will not proceed, Ashtead Shareholders will remain shareholders of Ashtead, and we will withdraw this Registration Statement from the SEC and our listing application from the NYSE, and the Ashtead Shares will continue to be listed in the Equity Shares (Commercial Companies) Category of the Official List and to be admitted to trading on the LSE’s main market for listed securities.
Once this Registration Statement is effective, we will be subject to the requirements of Section 13(a) of the Exchange Act, including the rules and regulations promulgated thereunder, which will require us to file, among other things, annual reports on Form 10-K, quarterly reports on Form 10-Q, and current reports on Form 8-K with the SEC, and we will be required to comply with all other obligations of the Exchange Act applicable to issuers filing registration statements pursuant to Section 12 of the Exchange Act. Accordingly, we have prepared the consolidated financial statements included in this Registration Statement based on GAAP (see also “—Critical Accounting Policies and Estimates” and “—Changes in Accounting Standards and Policies” below).
Key Factors Affecting Our Result of Operations
The results of our operations have been, and will continue to be, affected by many factors, some of which are beyond our control. This section sets out certain key factors we believe have affected our results of operations in the period under review and could affect our results of operations in the future.
Seasonality and Cyclicality
Our revenue and operating results remain significantly dependent on activity in the commercial construction industry in the United States, Canada and the United Kingdom. Commercial construction activity tends to increase in the summer and during extended periods of mild weather and to decrease in the winter and during extended periods of inclement weather. This results in changes in demand for our rental equipment. In addition, the commercial construction industries in the United States, Canada and the United Kingdom are cyclical industries with activity levels that tend to increase in line with GDP growth and decline during an economic downturn. The seasonality and cyclicality of the equipment rental industry results in variable demand for our products and therefore, our revenue and operating results may fluctuate from period to period.
Fleet Rotation and Depreciation
Due to the nature of our business, our cash flows are countercyclical. This means that in times of improving markets, we invest more in our rental fleet (both to replace existing fleet and to grow the overall fleet size), typically resulting in improved earnings but lower cash flow generation from operations in times of rapid growth. As we increase our fleet size, this also results in higher depreciation costs. On the contrary, in more benign or declining markets, we invest less in our rental fleet and, as a result, typically generate stronger cash flow from operations as the cycle matures and the growth slows. To maintain a balanced fleet, we may also adjust the sale of used equipment as a result of end market conditions, thus enhancing or negatively affecting revenue from such disposals.
Currency Translation Exposure
Currency risk is predominantly translation risk, as there are no significant transactions in the ordinary course of business that take place between foreign affiliates. Although our reporting currency is the U.S. dollar, we derived 15.1% of our revenue for the six months ended October 31, 2025 and 14.7% of our revenue for the fiscal year ended April 30, 2025 from companies that have non-U.S. dollar currencies, primarily British pounds and Canadian dollars. Consequently, any change in exchange rates between the U.S. dollar and the British pound or the Canadian dollar exposes us to translation risk and may significantly affect our consolidated results of operations and balance sheet (see also “—Quantitative and Qualitative Disclosures about Market Risk—Currency Risk” below).
46
Table of Contents
Global Economic Conditions
Our operations are impacted by global economic conditions, including inflation, tariffs, interest rate fluctuations and supply chain constraints, and we take actions to modify our plans to address such economic conditions. To date, the impact from supply chain disruptions has been limited, but we may experience more severe supply chain disruptions in the future. Interest rates on our debt instruments have increased in recent years. The most significant cost increases that are passed on to customers are for fuel and delivery, but there are other costs for which the pass through to customers is less direct, such as repairs and maintenance, and labor. Tariffs could result in the costs we incur being more than anticipated. The impact of inflation, tariffs and interest rate fluctuations may be significant in the future. We continue to assess the economic environment in which we operate and take appropriate actions to address the economic challenges we face. See Item 1A (Risk Factors) for further discussion of the risks related to us and our business.
Segment Information
Our reportable operating segments are: (i) North America – General Tool, (ii) North America – Specialty and (iii) the United Kingdom (see “Segment Information” under Item 1 (Business) for further information). This division reflects the basis upon which we review the performance of the business and allocate resources internally.
The Group manages debt, its lease portfolio, and taxation centrally, rather than by operating segments. Accordingly, segmental costs are stated excluding the impact of ASC 842 lease accounting in relation to the Company’s property leases, and before interest and taxation, which are reported as central Group items. There are no material sales between the operating segments.
As of the date of this Registration Statement, our Chief Executive Officer, as the chief operating decision maker (CODM), is the primary individual in control of resource allocation between the segments. Segment performance and resource allocation are evaluated based on adjusted segment operating profit. The most significant allocation determinations made by the CODM using adjusted segment operating profit relate to purchases of rental equipment, and these determinations are generally made as part of the annual budgeting process, with regular performance reviews occurring throughout the year that can result in allocation changes (for example, if a specific operating segment outperforms its plan, which could result in a reallocation of resources between operating segments or an increase in the total allocated resources).
In addition to segment results, we also report capital expenditure and assets by operating segment. Capital expenditure represents additions to rental equipment, property and equipment, and includes additions through the acquisition of businesses. Operating segment assets exclude corporate assets, such as cash and cash equivalents, corporate facilities and other intangible assets and tax assets.
The table below presents selected financial information by reportable segment.
| ($ in millions) |
North America – General Tool |
North America – Specialty |
United Kingdom |
|||||||||
| Six months ended October 31, 2025 |
||||||||||||
| Equipment rentals |
3,165 | 1,770 | 422 | |||||||||
| Sales of rental equipment |
146 | 44 | 21 | |||||||||
| Sales of new equipment, merchandise and consumables |
88 | 66 | 41 | |||||||||
|
|
|
|
|
|
|
|||||||
| Total revenues |
3,399 | 1,880 | 484 | |||||||||
|
|
|
|
|
|
|
|||||||
| Cost of rental equipment sales |
(126 | ) | (47 | ) | (15 | ) | ||||||
| Staff costs1) |
(662 | ) | (352 | ) | (137 | ) | ||||||
| Depreciation |
(704 | ) | (268 | ) | (90 | ) | ||||||
| Other segment items2) |
(790 | ) | (587 | ) | (204 | ) | ||||||
|
|
|
|
|
|
|
|||||||
| Adjusted segment operating profit |
1,117 | 626 | 38 | |||||||||
47
Table of Contents
| ($ in millions) |
North America – General Tool |
North America – Specialty |
United Kingdom |
|||||||||
| Six months ended October 31, 2024 |
||||||||||||
| Equipment rentals |
3,124 | 1,730 | 411 | |||||||||
| Sales of rental equipment |
179 | 43 | 26 | |||||||||
| Sales of new equipment, merchandise and consumables |
89 | 51 | 42 | |||||||||
|
|
|
|
|
|
|
|||||||
| Total revenues |
3,392 | 1,824 | 479 | |||||||||
|
|
|
|
|
|
|
|||||||
| Cost of rental equipment sales |
(150 | ) | (45 | ) | (17 | ) | ||||||
| Staff costs1) |
(626 | ) | (343 | ) | (133 | ) | ||||||
| Depreciation |
(685 | ) | (267 | ) | (86 | ) | ||||||
| Other segment items2) |
(740 | ) | (556 | ) | (195 | ) | ||||||
|
|
|
|
|
|
|
|||||||
| Adjusted segment operating profit |
1,191 | 613 | 48 | |||||||||
| Fiscal year ended April 30, 2025 |
||||||||||||
| Equipment rentals |
5,889 | 3,313 | 778 | |||||||||
| Sales of rental equipment |
338 | 79 | 50 | |||||||||
| Sales of new equipment, merchandise and consumables |
170 | 95 | 79 | |||||||||
|
|
|
|
|
|
|
|||||||
| Total revenues |
6,397 | 3,487 | 907 | |||||||||
|
|
|
|
|
|
|
|||||||
| Cost of rental equipment sales |
(280 | ) | (73 | ) | (33 | ) | ||||||
| Staff costs1) |
(1,224 | ) | (677 | ) | (258 | ) | ||||||
| Depreciation |
(1,384 | ) | (539 | ) | (171 | ) | ||||||
| Other segment items2) |
(1,416 | ) | (1,060 | ) | (372 | ) | ||||||
|
|
|
|
|
|
|
|||||||
| Adjusted segment operating profit |
2,093 | 1,138 | 73 | |||||||||
| Fiscal year ended April 30, 2024 |
||||||||||||
| Equipment rentals |
5,826 | 3,062 | 742 | |||||||||
| Sales of rental equipment |
721 | 73 | 65 | |||||||||
| Sales of new equipment, merchandise and consumables |
174 | 115 | 81 | |||||||||
|
|
|
|
|
|
|
|||||||
| Total segment revenues |
6,721 | 3,250 | 888 | |||||||||
| Cost of rental equipment sales |
(530 | ) | (66 | ) | (40 | ) | ||||||
| Staff costs1) |
(1,199 | ) | (696 | ) | (267 | ) | ||||||
| Depreciation |
(1,259 | ) | (470 | ) | (164 | ) | ||||||
| Other segment items2) |
(1,339 | ) | (1,054 | ) | (364 | ) | ||||||
|
|
|
|
|
|
|
|||||||
| Adjusted segment operating profit |
2,394 | 964 | 53 | |||||||||
| Fiscal year ended April 30, 2023 |
||||||||||||
| Equipment rentals |
5,292 | 2,734 | 672 | |||||||||
| Sales of rental equipment |
512 | 53 | 62 | |||||||||
| Sales of new equipment, merchandise and consumables |
152 | 101 | 89 | |||||||||
|
|
|
|
|
|
|
|||||||
| Total segment revenues |
5,956 | 2,888 | 823 | |||||||||
| Cost of rental equipment sales |
(360 | ) | (44 | ) | (38 | ) | ||||||
| Staff costs1) |
(1,081 | ) | (597 | ) | (217 | ) | ||||||
| Depreciation |
(1,070 | ) | (365 | ) | (142 | ) | ||||||
| Other segment items2) |
(1,231 | ) | (954 | ) | (348 | ) | ||||||
|
|
|
|
|
|
|
|||||||
| Adjusted segment operating profit |
2,214 | 928 | 78 | |||||||||
| 1) | Staff costs comprise salaries and related benefits and pension costs. |
| 2) | Other segment items comprise repairs and maintenance, vehicle, facility and other miscellaneous costs. |
48
Table of Contents
Adjusted segment operating profit
North America – General Tool. In the North America – General Tool segment, adjusted segment operating profit decreased by $74 million, or 6.2%, to $1,117 million in the six months ended October 31, 2025 from $1,191 million in the six months ended October 31, 2024, primarily due to a 2.8% increase in depreciation costs and a 5.8% increase in staff costs, reflecting the effects of inflation and investment in the infrastructure of the business to support growth in the six months ended October 31, 2025. In the fiscal year ended April 30, 2025 adjusted segment operating profit decreased by $301 million, or 12.6%, to $2,093 million from $2,394 million in the fiscal year ended April 30, 2024, primarily due to a 9.9% increase in depreciation expenses resulting from a larger average equipment fleet size, partially attributable to life cycle inflation, and higher repair and maintenance costs. In the fiscal year ended April 30, 2024 adjusted segment operating profit increased by $180 million, or 8.1%, to $2,394 million from $2,214 million in the fiscal year ended April 30, 2023, primarily due to volume growth in fleet on rent and favorable market conditions for sales of rental equipment.
North America – Specialty. In the North America – Specialty segment, adjusted segment operating profit increased by $13 million, or 2.1%, to $626 million in the six months ended October 31, 2025 from $613 million in the six months ended October 31, 2024, primarily due to increased rental rates with stable dollar utilization at 74%. In the fiscal year ended April 30, 2025 adjusted segment operating profit increased by $174 million, or 18.0%, to $1,138 million from $964 million in the fiscal year ended April 30, 2024, primarily due to strong rental revenue growth, including as a result of continued investment in and maturity of greenfield locations, partially offset by a 14.7% increase in depreciation expenses. In the fiscal year ended April 30, 2024 adjusted segment operating profit increased by $36 million, or 3.9%, to $964 million from $928 million in the fiscal year ended April 30, 2023, primarily due to volume growth in fleet on rent and strong market conditions, which were partially offset by a 28.8% increase in depreciation expenses attributable to a larger average equipment fleet size and a 16.6% increase in staff costs.
United Kingdom. In the United Kingdom segment, adjusted segment operating profit decreased by $10 million, or 20.8%, to $38 million in the six months ended October 31, 2025 from $48 million in the six months ended October 31, 2024. These results benefitted from favorable local currency movements; reported in local currency, adjusted segment operating profit decreased by 24.8%. The adverse adjusted segment operating profit movement arose primarily due to 4.7% and 3.0% increases in depreciation and staff costs, respectively. In the fiscal year ended April 30, 2025 adjusted segment operating profit increased by $20 million, or 37.7%, to $73 million from $53 million in the fiscal year ended April 30, 2024, primarily due to increased rental volume and rate. In the fiscal year ended April 30, 2024 adjusted segment operating profit decreased by $25 million, or 32.1%, to $53 million from $78 million in the fiscal year ended April 30, 2023, primarily due to 23.0% and 15.5% increases in staff and depreciation costs, respectively, partially offset by improved revenue from rental activities due to both rate and fleet on rent improvements.
Please see “—Results of Operations” below for a further discussion of our segment results during the periods presented.
Key Financial Metrics
We use the following KPIs and non-GAAP financial measures to analyze our business performance and financial position and to develop strategic plans, which we believe provide useful information to the market to aid in understanding and evaluating our results of operations and financial position in the same manner as our management team. Certain judgments and estimates are inherent in our process to calculate these metrics. These metrics are presented for supplemental information purposes only, should not be considered a substitute for financial information presented in accordance with GAAP, and may differ from similarly titled metrics or measures presented by other companies. See “—Non-GAAP Financial Measures” below for our definitions of these non-GAAP financial measures, information about how and why we use these non-GAAP financial measures and a reconciliation of each of these non-GAAP financial measures to its most directly comparable financial measure calculated in accordance with GAAP.
49
Table of Contents
The following table sets forth a summary of the key financial metrics.
| ($ in millions, unless otherwise stated) |
Six months ended October 31, | Fiscal year ended April 30, | ||||||||||||||||||
| 2025 | 2024 | 2025 | 2024 | 2023 | ||||||||||||||||
| Average net assets1) |
7,690 | 7,113 | 7,499 | 6,604 | 5,515 | |||||||||||||||
| Basic earnings per share ($ per share) |
1.90 | 2.06 | 3.56 | 3.60 | 3.66 | |||||||||||||||
| Debt to net income ratio |
5.2x | 5.4x | 4.8x | 5.1x | 4.1x | |||||||||||||||
| Long-term debt |
7,680 | 8,186 | 7,500 | 7,995 | 6,595 | |||||||||||||||
| Net assets |
7,564 | 7,586 | 7,799 | 7,060 | 6,010 | |||||||||||||||
| Net cash provided by operating activities |
1,865 | 1,938 | 3,844 | 3,664 | 3,346 | |||||||||||||||
| Net cash provided by operating activities to net income ratio |
231 | % | 216 | % | 248 | % | 233 | % | 208 | % | ||||||||||
| Net income |
809 | 899 | 1,553 | 1,572 | 1,605 | |||||||||||||||
| Net income margin |
14 | % | 16 | % | 14 | % | 14 | % | 17 | % | ||||||||||
| Operating income |
1,279 | 1,451 | 2,499 | 2,511 | 2,446 | |||||||||||||||
| Operating income margin |
22 | % | 25 | % | 23 | % | 23 | % | 25 | % | ||||||||||
| Return on investment |
19 | % | 21 | % | 21 | % | |
24 |
% |
|
29 |
% | ||||||||
| Adjusted average net assets2) |
17,708 | 17,522 | 17,733 | 16,461 | 13,532 | |||||||||||||||
| Adjusted cash conversion ratio2) |
90 | % | 95 | % | 99 | % | 92 | % | 92 | % | ||||||||||
| Adjusted EBITDA2) |
2,528 | 2,554 | 4,752 | 4,661 | 4,207 | |||||||||||||||
| Adjusted EBITDA margin2) |
44 | % | 45 | % | 44 | % | 43 | % | 44 | % | ||||||||||
| Adjusted EPS2) ($ per share) |
2.20 | 2.16 | 3.78 | 3.97 | 3.95 | |||||||||||||||
| Adjusted free cash flow2) |
1,047 | 367 | 1,685 | 126 | 441 | |||||||||||||||
| Adjusted leverage2) |
1.6x | 1.7x | 1.6x | 1.7x | 1.6x | |||||||||||||||
| Adjusted net assets |
17,529 | 18,003 | 17,556 | 17,239 | 14,534 | |||||||||||||||
| Adjusted operating profit2) |
1,445 | 1,496 | 2,615 | 2,735 | 2,598 | |||||||||||||||
| Adjusted operating profit margin2) |
25 | % | 26 | % | 24 | % | 25 | % | 27 | % | ||||||||||
| Adjusted pre-tax profit2) |
1,252 | 1,274 | 2,190 | 2,307 | 2,323 | |||||||||||||||
| Adjusted return on investment2) |
14 | % | 15 | % | 15 | % | 17 | % | 19 | % | ||||||||||
| Dollar utilization |
||||||||||||||||||||
| North America – General Tool |
47 | % | 49 | % | 48 | % | 51 | % | 53 | % | ||||||||||
| North America – Specialty |
74 | % | 74 | % | 73 | % | 74 | % | 84 | % | ||||||||||
| United Kingdom |
52 | % | 53 | % | 53 | % | 53 | % | 53 | % | ||||||||||
| EBITDA2) |
2,439 | 2,551 | 4,746 | 4,569 | 4,154 | |||||||||||||||
| EBITDA margin2) |
42 | % | 45 | % | 44 | % | 42 | % | 43 | % | ||||||||||
| Fleet on rent |
||||||||||||||||||||
| North America – General Tool |
8,495 | 8,078 | 7,830 | 7,549 | 6,856 | |||||||||||||||
| North America – Specialty |
2,109 | 2,021 | 2,055 | 1,901 | 1,623 | |||||||||||||||
| United Kingdom |
951 | 928 | 899 | 878 | 787 | |||||||||||||||
| Free cash flow2) |
1,013 | 367 | 1,675 | 126 | 441 | |||||||||||||||
| Net debt2) |
7,640 | 8,162 | 7,479 | 7,974 | 6,565 | |||||||||||||||
| 1) | Average net assets is calculated as net assets as of each month-end of the preceding thirteen months divided by thirteen. |
| 2) | Non-GAAP financial measure. See “—Non-GAAP Financial Measures” below for definitions and reconciliations to the most directly comparable GAAP measure. |
Key Performance Indicators
We use the KPIs “dollar utilization” and “fleet on rent,” to evaluate our business, measure our performance, identify trends and make business decisions. These measures are not directly comparable to, and should not be considered a substitute for, financial information presented in accordance with GAAP, and may differ from similarly titled metrics or measures presented by other companies.
50
Table of Contents
Dollar utilization
We consider “dollar utilization” to be a KPI on a segment basis. Dollar utilization reflects the ratio of rental revenue earned from equipment compared with the original cost of equipment and is calculated as revenue from equipment rentals in each month during the preceding twelve-month period divided by average fleet at original (or “first”) cost measured during such period, in each case on a segment basis. Dollar utilization is influenced by various factors, including the average original equipment cost of our rental fleet, the level of physical utilization of our rental fleet, customer rental rates, ancillary rental revenues, inflation, as well as customer and product mix.
Management believes that dollar utilization provides useful information to investors and management to demonstrate how effectively we recover value from our rental assets. Management uses dollar utilization when reviewing operating performance on a segment basis and to help inform capital allocation decisions within the business.
Fleet on rent
We consider “fleet on rent” to be a KPI on a segment basis. Fleet on rent reflects the daily average of the original cost of our serialized rental equipment on rent.
Management believes that fleet on rent provides useful information to investors and management to demonstrate the utilization of our rental equipment. Management uses fleet on rent when reviewing operating performance on a segment basis and to help inform capital allocation decisions within the business.
Non-GAAP Financial Measures
The consolidated financial statements included elsewhere in this Registration Statement have been prepared in accordance with GAAP. However, management believes that certain non-GAAP financial measures provide additional meaningful financial information that may be relevant when assessing its ongoing performance. We use the non-GAAP financial measures “adjusted average net assets,” “adjusted cash conversion ratio,” “adjusted EBITDA,” “adjusted EBITDA margin,” “adjusted EPS,” “adjusted free cash flow,” “adjusted leverage,” “adjusted net assets,” “adjusted operating profit,” “adjusted operating profit margin,” “adjusted pre-tax profit,” “adjusted return on investment,” “EBITDA,” “EBITDA margin,” “free cash flow,” and “net debt.” These financial measures are not defined or recognized under GAAP and are presented because we believe that these measures provide both management and users of our consolidated financial statements with useful additional information when evaluating our operating and financial performance. However, these non-GAAP financial measures should not be considered in isolation or as a substitute for the financial information prepared and presented in accordance with GAAP. They should not be viewed as alternatives to operating income (loss), net income (loss), operating cash flows, or other measures of financial performance or liquidity presented in accordance with GAAP. Consequently, the methodology used for their calculation may not be consistent with that adopted by other companies and, therefore, the non-GAAP measures presented in this Registration Statement may not be comparable with those of other companies. Some of the limitations of non-GAAP measures are that: (i) they do not reflect our cash expenditures or future requirements for capital investments or contractual commitments; (ii) they do not reflect changes in, or cash requirements for, our working capital needs; and (iii) they do not reflect the significant interest expense or cash requirements necessary to service interest or principal payments on our debt.
Adjusted cash conversion ratio
We use the non-GAAP measure “adjusted cash conversion ratio” to reflect the proportion of adjusted EBITDA converted into cash provided by operating activities before the cash outflow linked to interest payments and taxation. The composition of cash conversion ratio is not addressed or prescribed by GAAP. We define adjusted cash conversion ratio as net cash provided by operating activities before cash paid for interest and income taxes, net as a percentage of adjusted EBITDA.
Management believes that adjusted cash conversion ratio provides useful information to management and investors about the efficiency of our working capital management. Management further believes that using
51
Table of Contents
adjusted EBITDA as the profit component allows for a more meaningful comparison of our core cash conversion performance between different periods of time, as well as with those of similar companies.
The table below presents a reconciliation of the non-GAAP measure adjusted cash conversion ratio to net cash provided by operating activities to net income ratio, which represents, in management’s view, the most directly comparable GAAP measure, for the periods indicated.
| Six months ended October 31, | Fiscal year ended April 30, | |||||||||||||||||||
| ($ in millions, unless otherwise stated) | 2025 | 2024 | 2025 | 2024 | 2023 | |||||||||||||||
| Net cash provided by operating activities |
1,865 | 1,938 | 3,844 | 3,664 | 3,346 | |||||||||||||||
| Cash paid for interest |
182 | 220 | 416 | 392 | 245 | |||||||||||||||
| Cash paid for income taxes, net |
230 | 256 | 425 | 246 | 287 | |||||||||||||||
|
|
|
|
|
|
|
|
|
|
|
|||||||||||
| Net cash provided by operating activities before interest and taxation |
2,277 | 2,414 | 4,685 | 4,302 | 3,878 | |||||||||||||||
| Net income |
809 | 899 | 1,553 | 1,572 | 1,605 | |||||||||||||||
| Adjusted EBITDA1) |
2,528 | 2,554 | 4,752 | 4,661 | 4,207 | |||||||||||||||
|
|
|
|
|
|
|
|
|
|
|
|||||||||||
| Net cash provided by operating activities to net income ratio |
231 | % | 216 | % | 248 | % | 233 | % | 208 | % | ||||||||||
|
|
|
|
|
|
|
|
|
|
|
|||||||||||
| Adjusted cash conversion ratio |
90 | % | 95 | % | 99 | % | 92 | % | 92 | % | ||||||||||
| 1) | Adjusted EBITDA is a non-GAAP measure. Please see “—EBITDA, adjusted EBITDA, EBITDA margin and adjusted EBITDA margin” below for a reconciliation to net income, the most directly comparable GAAP measure. |
Adjusted EPS
We use the non-GAAP measure “adjusted EPS” to evaluate the underlying profitability of our core operations. The composition of adjusted EPS is not addressed or prescribed by GAAP. We define adjusted EPS as earnings per share (basic) before amortization of acquired intangibles, stock based compensation expense, net and restructuring costs, which in the fiscal year ended April 30, 2025 relate to costs associated with the Redomiciliation and U.S. Listing and in the six months ended October 31, 2025 relate to costs associated with the Redomiciliation and U.S. Listing and the operational restructure of the United Kingdom segment, in each case less taxation on adjusting items.
Management believes that adjusted EPS provides useful information to management and investors about the Group’s underlying profitability without regard to non-core items that may not be indicative of our main business activities, thus allowing for a more meaningful comparison between our core performance over different periods of time, as well as with those of similar companies.
52
Table of Contents
The table below presents a reconciliation of the non-GAAP measure adjusted EPS to basic earnings per share, which in management’s view is the most directly comparable GAAP measure, for the periods indicated.
| Six months ended October 31, | Fiscal year ended April 30, | |||||||||||||||||||
| ($) | 2025 | 2024 | 2025 | 2024 | 2023 | |||||||||||||||
| Basic earnings per share |
1.90 | 2.06 | 3.56 | 3.60 | 3.66 | |||||||||||||||
| Amortization of acquired intangibles |
0.13 | 0.13 | 0.26 | 0.28 | 0.27 | |||||||||||||||
| Stock based compensation expense, net |
0.08 | 0.01 | (0.02 | ) | 0.21 | 0.12 | ||||||||||||||
| Restructuring costs:1) |
||||||||||||||||||||
| Staff costs |
0.03 | 0.00 | 0.01 | 0.00 | 0.00 | |||||||||||||||
| Impairment |
0.04 | 0.00 | 0.00 | 0.00 | 0.00 | |||||||||||||||
| Other restructuring costs |
0.10 | 0.00 | 0.03 | 0.00 | 0.00 | |||||||||||||||
| Taxation on adjusting items2) |
(0.08 | ) | (0.04 | ) | (0.06 | ) | (0.12 | ) | (0.10 | ) | ||||||||||
|
|
|
|
|
|
|
|
|
|
|
|||||||||||
| Adjusted EPS |
2.20 | 2.16 | 3.78 | 3.97 | 3.95 | |||||||||||||||
| Weighted-average common shares used in per share calculations |
425,647,876 | 436,737,953 | 435,873,592 | 436,988,043 | 439,086,356 | |||||||||||||||
| 1) | Restructuring costs relate to staff, impairment and other costs incurred in relation to the Redomiciliation and U.S. Listing and, in the six months ended October 31, 2025, the operational restructure of the United Kingdom segment. |
| 2) | Taxation on adjusting items reflects the tax arising in relation to the items detailed above, calculated at the statutory rate of the relevant jurisdiction. |
Adjusted leverage
We use the non-GAAP measure “adjusted leverage” to provide an indication of the strength of the Group’s balance sheet. The composition of adjusted leverage is not addressed or prescribed by GAAP. We define adjusted leverage as net debt divided by adjusted EBITDA generated during the preceding twelve-month period.
Management believes that providing an indication of the strength of the Group’s balance sheet provides useful additional information to management and investors. Management further believes that using adjusted EBITDA as the profit component for adjusted leverage allows for a more meaningful comparison of our financial position between different periods of time, as well as with those of similar companies. Adjusted leverage also forms part of the executive compensation targets of the Group.
The table below presents a reconciliation of the non-GAAP measure adjusted leverage to debt to net income ratio, which represents, in management’s view, the most directly comparable GAAP measure, for the periods indicated.
| Six months ended October 31, | Fiscal year ended April 30, | |||||||||||||||||||
| ($ in millions) | 2025 | 2024 | 2025 | 2024 | 2023 | |||||||||||||||
| Net income1) |
1,463 | 1,521 | 1,553 | 1,572 | 1,605 | |||||||||||||||
| Adjusted EBITDA2) 3) |
4,726 | 4,732 | 4,752 | 4,661 | 4,207 | |||||||||||||||
| Long-term debt4) |
7,680 | 8,186 | 7,500 | 7,995 | 6,595 | |||||||||||||||
| Net debt5) |
7,640 | 8,162 | 7,479 | 7,974 | 6,565 | |||||||||||||||
| Debt to net income ratio |
5.2x | 5.4x | 4.8x | 5.1x | 4.1x | |||||||||||||||
| Adjusted leverage |
1.6x | 1.7x | 1.6x | 1.7x | 1.6x | |||||||||||||||
| 1) | Net income generated during the preceding twelve-month period. |
| 2) | Adjusted EBITDA is a non-GAAP measure. Please see “—EBITDA, adjusted EBITDA, EBITDA margin and adjusted EBITDA margin” below for a reconciliation to net income, the most directly comparable GAAP measure. |
53
Table of Contents
| 3) | Adjusted EBITDA generated during the preceding twelve-month period. |
| 4) | Long-term debt includes outstanding amounts under our ABL Facility and Senior Notes. |
| 5) | Net debt is a non-GAAP measure. Please “—Net debt” see below for a reconciliation to long-term debt, the most directly comparable GAAP measure. |
Adjusted average net assets, adjusted net assets and adjusted return on investment
We use the non-GAAP measures “adjusted average net assets,” “adjusted net assets” and “adjusted return on investment” to provide a measure of how effectively we allocate capital to profitable investments. The composition of these measures is not addressed or prescribed by GAAP. We define adjusted net assets as net assets excluding net debt and tax. Adjusted average net assets is defined as adjusted net assets as of each month-end of the preceding thirteen months divided by thirteen. Adjusted return on investment is defined as adjusted operating profit generated during the preceding twelve-month period divided by adjusted average net assets.
Management believes that a measure of return on investment is widely used by investors. By using adjusted operating profit as the profit component, adjusted return on investment focuses on returns from our actual operating assets and profits generated from our main business activities, which management believes allows for a more meaningful comparison of our operating efficiency between different periods of time, as well as with those of similar companies. Management further uses adjusted return on investment when reviewing operating performance to help inform capital allocation decisions within the business. It also represents one of the metrics used in our executive compensation program.
The table below presents a reconciliation of the non-GAAP measures adjusted net assets and adjusted average net assets to net assets, as well as adjusted return on investment to return on investment, which in each case represents, in management’s view, the most directly comparable GAAP measure, for the periods indicated.
| ($ in millions, unless otherwise stated) | Six months ended October 31, | Fiscal year ended April 30, | ||||||||||||||||||
| 2025 | 2024 | 2025 | 2024 | 2023 | ||||||||||||||||
| Net income1) |
1,463 | 1,521 | 1,553 | 1,572 | 1,605 | |||||||||||||||
| Adjusted operating profit2) 3) |
2,564 | 2,675 | 2,615 | 2,735 | 2,598 | |||||||||||||||
| Net assets |
7,564 | 7,586 | 7,799 | 7,060 | 6,010 | |||||||||||||||
| Add back: Net debt |
7,640 | 8,162 | 7,479 | 7,974 | 6,565 | |||||||||||||||
| Add back: Tax |
2,325 | 2,255 | 2,278 | 2,205 | 1,959 | |||||||||||||||
|
|
|
|
|
|
|
|
|
|
|
|||||||||||
| Adjusted net assets |
17,529 | 18,003 | 17,556 | 17,239 | 14,534 | |||||||||||||||
| Average net assets4) |
7,690 | 7,113 | 7,499 | 6,604 | 5,515 | |||||||||||||||
| Adjusted average net assets |
17,708 | 17,522 | 17,733 | 16,461 | 13,532 | |||||||||||||||
| Return on investment |
19 | % | 21 | % | 21 | % | 24 | % | 29 | % | ||||||||||
| Adjusted return on investment |
14 | % | 15 | % | 15 | % | 17 | % | 19 | % | ||||||||||
| 1) | Net income generated during the preceding twelve-month period. |
| 2) | Adjusted operating profit is a non-GAAP measure. Please see “—Adjusted operating profit and adjusted operating profit margin” below for a reconciliation to net income, the most directly comparable GAAP measure. |
| 3) | Adjusted operating profit generated during the preceding twelve-month period. |
| 4) | Average net assets is calculated as net assets as of each month-end of the preceding thirteen months divided by thirteen. |
Adjusted operating profit and adjusted operating profit margin
We use the non-GAAP measures “adjusted operating profit” and “adjusted operating profit margin” to evaluate the underlying profitability of our core operations. The composition of these measures is not addressed or prescribed by GAAP. We define adjusted operating profit as operating income after other expense, net and before amortization of acquired intangibles, stock-based compensation expense, net, and restructuring costs,
54
Table of Contents
which in the fiscal year ended April 30, 2025 relate to costs associated with the Redomiciliation and U.S. Listing and in the six months ended October 31, 2025 relate to costs associated with the Redomiciliation and U.S. Listing and the operational restructure of the United Kingdom segment. Adjusted operating profit margin is defined as adjusted operating profit divided by total revenues.
Management believes that adjusted operating profit and adjusted operating profit margin provide useful information to management and investors about the Group’s underlying profitability without regard to non-core items that may not be indicative of our main business activities, thus allowing for a more meaningful comparison between our core performance over different periods of time, as well as with those of other similar companies.
The table below presents a reconciliation of the non-GAAP measure adjusted operating profit to operating income, as well as adjusted operating profit margin to operating income margin, which in each case represents, in management’s view, the most directly comparable GAAP measure, for the periods indicated.
| ($ in millions, unless otherwise stated) | Six months ended October 31, | Fiscal year ended April 30, | ||||||||||||||||||
| 2025 | 2024 | 2025 | 2024 | 2023 | ||||||||||||||||
| Operating income |
1,279 | 1,451 | 2,499 | 2,511 | 2,446 | |||||||||||||||
| Other expense (income), net |
5 | (16 | ) | (4 | ) | 11 | (19 | ) | ||||||||||||
| Amortization of acquired intangibles |
56 | 58 | 114 | 121 | 118 | |||||||||||||||
| Stock based compensation expense, net |
34 | 3 | (9 | ) | 92 | 53 | ||||||||||||||
| Restructuring costs:1) |
||||||||||||||||||||
| Staff costs |
13 | — | 4 | — | — | |||||||||||||||
| Impairment |
16 | — | — | — | — | |||||||||||||||
| Other restructuring costs |
42 | — | 11 | — | — | |||||||||||||||
|
|
|
|
|
|
|
|
|
|
|
|||||||||||
| Adjusted operating profit |
1,445 | 1,496 | 2,615 | 2,735 | 2,598 | |||||||||||||||
| Total revenues |
5,763 | 5,695 | 10,791 | 10,859 | 9,667 | |||||||||||||||
| Operating income margin2) |
22 | % | 25 | % | 23 | % | 23 | % | 25 | % | ||||||||||
|
|
|
|
|
|
|
|
|
|
|
|||||||||||
| Adjusted operating profit margin |
25 | % | 26 | % | 24 | % | 25 | % | 27 | % | ||||||||||
| 1) | Restructuring costs relate to staff, impairment and other costs incurred in relation to the Redomiciliation and U.S. Listing and, in the six months ended October 31, 2025, the operational restructure of the United Kingdom segment. |
| 2) | Operating income margin is calculated as operating income divided by total revenues. |
Adjusted pre-tax profit
We use the non-GAAP measure “adjusted pre-tax profit” to evaluate the underlying profitability of our core operations. The composition of adjusted pre-tax profit is not addressed or prescribed by GAAP. We define adjusted pre-tax profit as net income before provision for income taxes, amortization of acquired intangibles, stock based compensation expense, net and restructuring costs, which in the fiscal year ended April 30, 2025 relate to costs associated with the Redomiciliation and U.S. Listing and in the six months ended October 31, 2025 relate to costs associated with the Redomiciliation and U.S. Listing and the operational restructure of the United Kingdom segment. Adjusted pre-tax profit represents adjusted operating profit after interest expense, net.
Management believes that adjusted pre-tax profit provides useful information to management and investors about the Group’s underlying profitability without regard to non-core items that may not be indicative of our main business activities, thus allowing for a more meaningful comparison between our core performance over different periods of time, as well as with those of other similar companies.
55
Table of Contents
The table below presents a reconciliation of the non-GAAP measure adjusted pre-tax profit to net income, which represents, in management’s view, the most directly comparable GAAP measure, for the periods indicated.
| ($ in millions) |
Six months ended October 31, | Fiscal year ended April 30, | ||||||||||||||||||
| 2025 | 2024 | 2025 | 2024 | 2023 | ||||||||||||||||
| Net income |
809 | 899 | 1,553 | 1,572 | 1,605 | |||||||||||||||
| Provision for income taxes |
282 | 314 | 517 | 522 | 547 | |||||||||||||||
| Amortization of acquired intangibles |
56 | 58 | 114 | 121 | 118 | |||||||||||||||
| Stock based compensation expense, net |
34 | 3 | (9 | ) | 92 | 53 | ||||||||||||||
| Restructuring costs:1) |
||||||||||||||||||||
| Staff costs |
13 | — | 4 | — | — | |||||||||||||||
| Impairment |
16 | — | — | — | — | |||||||||||||||
| Other restructuring costs |
42 | — | 11 | — | — | |||||||||||||||
|
|
|
|
|
|
|
|
|
|
|
|||||||||||
| Adjusted pre-tax profit |
1,252 | 1,274 | 2,190 | 2,307 | 2,323 | |||||||||||||||
| 1) | Restructuring costs relate to staff, impairment and other costs incurred in relation to the Redomiciliation and U.S. Listing and, in the six months ended October 31, 2025, the operational restructure of the United Kingdom segment. |
EBITDA, adjusted EBITDA, EBITDA margin and adjusted EBITDA margin
We use the non-GAAP measures “EBITDA,” “adjusted EBITDA,” “EBITDA margin,” and “adjusted EBITDA margin” to evaluate our overall financial performance. The composition of these measures is not addressed or prescribed by GAAP. We define EBITDA as net income before provision for income taxes, interest expense, net, depreciation of rental equipment and non-rental depreciation and amortization. Adjusted EBITDA represents EBITDA before stock based compensation expense, net and restructuring costs, which in the fiscal year ended April 30, 2025 relate to costs associated with the Redomiciliation and U.S. Listing and in the six months ended October 31, 2025 relate to costs associated with the Redomiciliation and U.S. Listing and the operational restructure of the United Kingdom segment. These items are excluded from adjusted EBITDA to allow investors to make a more meaningful comparison between our core performance over different periods of time, as well as with those of similar companies. EBITDA margin is defined as EBITDA divided by total revenues. Adjusted EBITDA margin is defined as adjusted EBITDA divided by total revenues.
Management believes that EBITDA, adjusted EBITDA, EBITDA margin, and adjusted EBITDA margin, when viewed with the Company’s results under GAAP and the accompanying reconciliations, provide useful information about our operating performance and period-over-period growth, and provide additional information that is useful for evaluating the operating performance of our core business without regard to potential distortions. Additionally, management believes that EBITDA and adjusted EBITDA help investors gain an understanding of the factors and trends affecting our ongoing cash earnings, from which capital investments are made and debt is serviced.
The table below presents a reconciliation of the non-GAAP measures EBITDA and adjusted EBITDA to net income, as well as the EBITDA margin and adjusted EBITDA margin to net income margin, which in each case represents, in management’s view, the most directly comparable GAAP measure, for the periods indicated.
| ($ in millions, unless otherwise stated) |
Six months ended October 31, | Fiscal year ended April 30, | ||||||||||||||||||
| 2025 | 2024 | 2025 | 2024 | 2023 | ||||||||||||||||
| Net income |
809 | 899 | 1,553 | 1,572 | 1,605 | |||||||||||||||
| Provision for income taxes |
282 | 314 | 517 | 522 | 547 | |||||||||||||||
| Interest expense, net |
193 | 222 | 425 | 428 | 275 | |||||||||||||||
| Depreciation of rental equipment |
925 | 902 | 1,815 | 1,653 | 1,393 | |||||||||||||||
| Non-rental depreciation and amortization |
230 | 214 | 436 | 394 | 334 | |||||||||||||||
|
|
|
|
|
|
|
|
|
|
|
|||||||||||
| EBITDA |
2,439 | 2,551 | 4,746 | 4,569 | 4,154 | |||||||||||||||
| Stock based compensation expense, net |
34 | 3 | (9 | ) | 92 | 53 | ||||||||||||||
56
Table of Contents
| ($ in millions, unless otherwise stated) |
Six months ended October 31, | Fiscal year ended April 30, | ||||||||||||||||||
| 2025 | 2024 | 2025 | 2024 | 2023 | ||||||||||||||||
| Restructuring costs:1) |
||||||||||||||||||||
| Staff costs |
13 | — | 4 | — | — | |||||||||||||||
| Other restructuring costs |
42 | — | 11 | — | — | |||||||||||||||
|
|
|
|
|
|
|
|
|
|
|
|||||||||||
| Adjusted EBITDA |
2,528 | 2,554 | 4,752 | 4,661 | 4,207 | |||||||||||||||
| Total revenues |
5,763 | 5,695 | 10,791 | 10,859 | 9,667 | |||||||||||||||
| Net income margin2) |
14 | % | 16 | % | 14 | % | 14 | % | 17 | % | ||||||||||
| EBITDA margin |
42 | % | 45 | % | 44 | % | 42 | % | 43 | % | ||||||||||
| Adjusted EBITDA margin |
44 | % | 45 | % | 44 | % | 43 | % | 44 | % | ||||||||||
| 1) | Restructuring costs relate to staff and other costs incurred in relation to the Redomiciliation and U.S. Listing and, in the six months ended October 31, 2025, the operational restructure of the United Kingdom segment. |
| 2) | Net income margin is calculated as net income divided by total revenues. |
Free cash flow and adjusted free cash flow
We use the non-GAAP measures “free cash flow” and “adjusted free cash flow” to reflect the cash retained by the Group prior to discretionary expenditure on acquisitions and returns to shareholders. The composition of these measures is not addressed or prescribed by GAAP. We define free cash flow as net cash provided by operating activities less net expenditure on rental and non-rental equipment (comprising payments for purchases of equipment less disposal proceeds received in relation to sales of equipment). Adjusted free cash flow is defined as free cash flow plus restructuring costs associated with the Redomiciliation and U.S. Listing and the operational restructure of the United Kingdom segment.
Management believes that free cash flow and adjusted free cash flow provide useful information to management and investors as an additional liquidity measure because it measures the amount of cash available, after net expenditures on rental and non-rental equipment, for activities such as making discretionary expenditures on acquisitions and providing returns to shareholders. Management further believes that adjusting for restructuring costs provides investors with more comparable result between the periods, without regard to non-core items that may not be indicative of our main business activities.
The table below presents a reconciliation of the non-GAAP measures free cash flow and adjusted free cash flow to net cash provided by operating activities, which represents, in management’s view, the most directly comparable GAAP measure, for the periods indicated.
| Six months ended October 31, | Fiscal year ended April 30, | |||||||||||||||||||
| ($ in millions) |
2025 | 2024 | 2025 | 2024 | 2023 | |||||||||||||||
| Net cash provided by operating activities |
1,865 | 1,938 | 3,844 | 3,664 | 3,346 | |||||||||||||||
| Payments for purchases of rental equipment |
(872 | ) | (1,518 | ) | (2,251 | ) | (3,759 | ) | (3,020 | ) | ||||||||||
| Payments for non-rental property and equipment |
(197 | ) | (298 | ) | (441 | ) | (659 | ) | (500 | ) | ||||||||||
| Proceeds from sales of rental equipment |
194 | 215 | 462 | 832 | 574 | |||||||||||||||
| Proceeds from disposal of non-rental property and equipment |
23 | 30 | 61 | 48 | 41 | |||||||||||||||
|
|
|
|
|
|
|
|
|
|
|
|||||||||||
| Free cash flow |
1,013 | 367 | 1,675 | 126 | 441 | |||||||||||||||
| Add back: Restructuring costs1) |
34 | — | 10 | — | — | |||||||||||||||
|
|
|
|
|
|
|
|
|
|
|
|||||||||||
| Adjusted free cash flow |
1,047 | 367 | 1,685 | 126 | 441 | |||||||||||||||
| 1) | Restructuring costs relate to staff and other costs incurred in relation to the Redomiciliation and U.S. Listing and, in the six months ended October 31, 2025, the operational restructure of the United Kingdom segment. |
57
Table of Contents
Net debt
We use the non-GAAP measure “net debt” to provide an indication of the overall level of our long-term indebtedness. The composition of net debt is not addressed or prescribed by GAAP. We define net debt as total long-term debt less cash balances.
Management believes that net debt is widely used by investors and credit rating agencies and provides useful additional information to management and investors as an indication of the Group’s financial position and ability to meet its financial obligations.
The table below presents a reconciliation of the non-GAAP measure net debt to long-term debt, which represents, in management’s view, the most directly comparable GAAP measure, for the periods indicated.
| ($ in millions) |
Six months ended October 31, | Fiscal year ended April 30, | ||||||||||||||||||
| 2025 | 2024 | 2025 | 2024 | 2023 | ||||||||||||||||
| Long-term debt1) |
7,680 | 8,186 | 7,500 | 7,995 | 6,595 | |||||||||||||||
| Cash and cash equivalents |
(40 | ) | (24 | ) | (21 | ) | (21 | ) | (30 | ) | ||||||||||
|
|
|
|
|
|
|
|
|
|
|
|||||||||||
| Net debt |
7,640 | 8,162 | 7,479 | 7,974 | 6,565 | |||||||||||||||
| 1) | Long-term debt includes outstanding amounts under our ABL Facility and Senior Notes. |
Components of Results of Operations
Revenues
Our revenues are derived primarily from renting equipment to customers. Ancillary to our principal equipment rental business, we also generate revenue from the sale of used rental equipment, the sale of new equipment, merchandise and consumables, and the provision of certain services to support our customers. Sales and other tax amounts collected from customers and remitted to government authorities are accounted for on a net basis and, therefore, excluded from revenue.
Equipment rentals primarily includes (i) revenue generated from renting equipment to customers, including re-rent revenue generated from renting specific pieces of equipment from third-parties and then re-renting that equipment to our customers, (ii) fees for loss damage waiver, which allow customers to limit the risk of financial loss in the event our equipment is damaged or lost, and (iii) delivery and collection revenue, which relates to the fees charged to our customers for equipment delivery and collection of rental equipment.
Equipment rentals revenue is recognized on a straight-line basis over the period of the rental contract. These lease contracts are operating leases under ASC 842. As a rental contract can extend across financial reporting periods, we record accrued revenue (unbilled rental revenue) and deferred revenue at the beginning and end of each reporting period so that equipment rentals revenue is stated appropriately in the financial statements. Receivables from unbilled equipment rentals revenue are included in “Prepaid expenses and other current assets” and deferred equipment rentals revenue is included in “Accrued expenses and other liabilities” in the consolidated balance sheet. Provisions for discounts, rebates to customers and other adjustments are provided for in the period the related equipment rentals revenue is recorded.
Delivery and collection revenue is recognized when the delivery or collection, respectively, has occurred and the performance obligation is therefore fulfilled.
Sales of rental equipment comprises our revenue from the sale of used rental equipment, which is recognized when control of the asset transfers to the customer, which is typically when the asset is picked up by, or delivered to, the customer and when significant risks and rewards of ownership have passed to the customer.
58
Table of Contents
Revenue from the sale of rental equipment in connection with trade-in arrangements with certain manufacturers from whom we purchase new equipment is accounted for at the lower of transaction value or fair value based on independent appraisals. If the trade-in price of a unit of equipment exceeds the fair market value of that unit, the excess is accounted for as a reduction of the cost of the related purchase of new rental equipment.
Sales of new rental equipment, merchandise and consumables comprises our revenue from the sale of new rental equipment, parts, and supplies, which is recognized in the same manner as the sale of used rental equipment, as well as revenue earned from equipment management and similar services for rental customers, which is recognized as the services are provided. The types of new equipment that we sell vary by location and include a variety of tools and supplies, small equipment, safety supplies and consumables.
Cost of Revenues
Our cost of revenues is comprised of the costs incurred in connection with the rental and sale of our products and services, including depreciation of rental equipment.
Cost of equipment rentals, excluding depreciation comprises the costs associated with the rental of our equipment, such as staff costs at our stores, including: salaries and related benefits and pension costs; delivery and fuel costs; spare equipment costs; repair and maintenance costs; insurance costs; warranty claim costs; cost of consumables; variable lease costs and short-term lease costs associated with renting equipment from third-parties and then re-renting that equipment to our customers; and rent and utilities related to the local store facilities in which we operate.
Depreciation of rental equipment comprises the depreciation costs for our rental fleet. Rental equipment is recorded at cost and depreciated over the estimated useful life of the equipment to its residual value using the straight-line method.
Cost of rental equipment sales comprises the costs associated with the sale of our used equipment, including the net book value of the rental assets sold and associated sales costs, such as auction fees.
Cost of sales of new equipment, merchandise and consumables comprises the costs associated with the sale of new equipment, merchandise and consumables and related services, including the cost of merchandise and new equipment.
Selling, General and Administrative Expenses
Selling, general and administrative expenses comprise operating costs that are not directly related to our revenue generating activities. These costs primarily include: sales commissions; staff costs for management and support staff, including salaries and related benefits and pension costs; legal and professional fees; restructuring costs related to the Redomiciliation and U.S. Listing; bad debt charges; advertising expenses; technology licensing costs; and administrative overhead expenses.
Non-rental Depreciation and Amortization
Non-rental depreciation and amortization includes depreciation expenses related to property and equipment, including land and buildings, motor vehicles, and office and workshop equipment, as well as amortization of intangible assets, including customer lists and contracts, and amortization of finance lease right-of-use assets.
Interest Expense, Net
Interest expense, net comprises the difference between interest receivable on funds invested and interest payable on borrowings and lease liabilities.
59
Table of Contents
Other Expense (Income), Net
Other expense (income), net comprises gains/losses from disposals of non-rental assets, changes due to foreign currency exchanges, gains/losses from the remeasurement of equity investments and various other miscellaneous non-operating expenses.
Provision for Income Taxes
Provision for income taxes consists of an estimate of U.S. federal and state, Canadian, U.K., and foreign income taxes based on enacted U.S. federal and state, Canadian, U.K., and foreign tax rates, as adjusted for allowable credits, deductions, uncertain tax positions, changes in the valuation of our deferred tax assets and liabilities, and changes in tax laws. We continue to maintain a valuation allowance related to specific net deferred tax assets where it is not more likely than not that the deferred tax assets will be realized.
Results of Operations
The table below summarizes our consolidated results of operations for the periods indicated.
| ($ in millions) | Six months ended October 31, | Fiscal year ended April 30, | ||||||||||||||||||
| 2025 | 2024 | 2025 | 2024 | 2023 | ||||||||||||||||
| Revenues: |
||||||||||||||||||||
| Equipment rentals |
5,357 | 5,265 | 9,980 | 9,630 | 8,698 | |||||||||||||||
| Sales of rental equipment |
211 | 248 | 467 | 859 | 627 | |||||||||||||||
| Sales of new equipment, merchandise and consumables |
195 | 182 | 344 | 370 | 342 | |||||||||||||||
|
|
|
|
|
|
|
|
|
|
|
|||||||||||
| Total revenues |
5,763 | 5,695 | 10,791 | 10,859 | 9,667 | |||||||||||||||
| Cost of revenues: |
||||||||||||||||||||
| Cost of equipment rentals, excluding depreciation |
2,199 | 2,079 | 4,069 | 3,874 | 3,503 | |||||||||||||||
| Depreciation of rental equipment |
925 | 902 | 1,815 | 1,653 | 1,393 | |||||||||||||||
| Cost of rental equipment sales |
191 | 212 | 386 | 636 | 442 | |||||||||||||||
| Cost of sales of new equipment, merchandise and consumables |
120 | 107 | 201 | 219 | 201 | |||||||||||||||
|
|
|
|
|
|
|
|
|
|
|
|||||||||||
| Total cost of revenues |
3,435 | 3,300 | 6,471 | 6,382 | 5,539 | |||||||||||||||
|
|
|
|
|
|
|
|
|
|
|
|||||||||||
| Gross profit |
2,328 | 2,395 | 4,320 | 4,477 | 4,128 | |||||||||||||||
| Selling, general and administrative expenses |
819 | 730 | 1,385 | 1,572 | 1,348 | |||||||||||||||
| Non-rental depreciation and amortization |
230 | 214 | 436 | 394 | 334 | |||||||||||||||
|
|
|
|
|
|
|
|
|
|
|
|||||||||||
| Operating income |
1,279 | 1,451 | 2,499 | 2,511 | 2,446 | |||||||||||||||
| Interest expense, net |
193 | 222 | 425 | 428 | 275 | |||||||||||||||
| Other expense (income), net |
(5 | ) | 16 | 4 | (11 | ) | 19 | |||||||||||||
|
|
|
|
|
|
|
|
|
|
|
|||||||||||
| Income before provision for income taxes |
1,091 | 1,213 | 2,070 | 2,094 | 2,152 | |||||||||||||||
| Provision for income taxes |
282 | 314 | 517 | 522 | 547 | |||||||||||||||
|
|
|
|
|
|
|
|
|
|
|
|||||||||||
| Net income |
809 | 899 | 1,553 | 1,572 | 1,605 | |||||||||||||||
|
|
|
|
|
|
|
|
|
|
|
|||||||||||
Six Months Ended October 31, 2025 Compared With Six Months Ended October 31, 2024
Revenues
Equipment rentals. Total equipment rental revenues increased by $92 million, or 1.7%, to $5,357 million in the six months ended October 31, 2025 from $5,265 million in the six months ended October 31, 2024, representing 93.0% and 92.4% of total revenues in the six months ended October 31, 2025 and October 31, 2024,
60
Table of Contents
respectively. The increase in total equipment rental revenues is attributable to increases in rental volume (or fleet on rent) in both of our North American segments, as well as rental rate improvement in the North America – Specialty segment, partially offset by lower hurricane activity in the period. We estimate that hurricane response efforts contributed $55 million to $60 million to total equipment rental revenues in the six months ended October 31, 2024, which did not recur in the six months ended October 31, 2025. In the six months ended October 31, 2025, our dollar utilization was 54%, compared to 55% as of October 31, 2024. The average original equipment cost of our rental fleet increased by 3.0% in the six months ended October 31, 2025 compared to the six months ended October 31, 2024. See “—Key Financial Metrics—Key Performance Indicators” above for a definition and further information on dollar utilization.
On a segment basis, equipment rental revenues attributable to the North America – General Tool, North America – Specialty and United Kingdom segments represented 59.1%, 33.0% and 7.9%, respectively, of total equipment rental revenues in the six months ended October 31, 2025, compared to 59.3%, 32.9% and 7.8% in the six months ended October 31, 2024.
North America – General Tool. Equipment rental revenues attributable to the North America – General Tool segment increased by $41 million, or 1.3%, to $3,165 million in the six months ended October 31, 2025 from $3,124 million in the six months ended October 31, 2024. This increase was primarily attributable to a 5.2% increase in the volume of fleet on rent, and partially offset by the effects of customer and product mix. The segment’s dollar utilization decreased from 49% as of October 31, 2024 to 47% as of October 31, 2025, reflecting lower average physical utilization in the 12-month period ended October 31, 2025. In the six months ended October 31, 2025, equipment rental revenues attributable to same-store and greenfield sites increased by 0.6% compared to the six months ended October 31, 2024, while revenues attributable to bolt-on acquisitions since May 1, 2025 contributed 0.7% of equipment rental revenue growth over the same period.
North America – Specialty. Equipment rental revenues attributable to the North America – Specialty segment increased by $40 million, or 2.3%, to $1,770 million in the six months ended October 31, 2025 from $1,730 million in the six months ended October 31, 2024. This increase was due to a 4.3% increase in the volume of fleet on rent and increased rental rates in the six months ended October 31, 2025, and partially offset by the effects of customer and product mix. We estimate that hurricane response efforts contributed $38 million to $43 million to North America – Specialty equipment rental revenues in the six months ended October 31, 2024, which did not recur in the six months ended October 31, 2025. Excluding the impact of these contributions to equipment rental revenues in the North America – Specialty segment in the six months ended October 31, 2024, we estimate that equipment rental revenues in the six months ended October 31, 2025 would have been approximately 5% higher period over period. The segment’s dollar utilization remained stable at 74%. In the six months ended October 31, 2025, equipment rental revenues attributable to same-store and greenfield sites increased by 2.2% compared to the six months ended October 31, 2024, while equipment rental revenues attributable to bolt-on acquisitions since May 1, 2025 contributed 0.1% of equipment rental revenue growth over the same period.
United Kingdom. Equipment rental revenues attributable to the United Kingdom segment increased by $11 million, or 2.6%, to $422 million in the six months ended October 31, 2025 from $411 million in the six months ended October 31, 2024. This increase was primarily due to favorable foreign exchange movements, with equipment rental revenues in local currency (in British pounds) 1.7% lower compared to the six months ended October 31, 2024.
Sales of rental equipment. Total revenues from the sale of rental equipment decreased by $37 million, or 14.9%, to $211 million in the six months ended October 31, 2025 from $248 million in the six months ended October 31, 2024, representing 3.7% and 4.4% of total revenues in the six months ended October 31, 2025 and October 31, 2024, respectively. This decrease in sales of rental equipment reflects a lower volume of used equipment sales compared to the six months ended October 31, 2024.
61
Table of Contents
On a segment basis, revenues from the sale of rental equipment attributable to the North America – General Tool, North America – Specialty and United Kingdom segments represented 69.2%, 20.8% and 10.0%, respectively, of total revenues from the sale of rental equipment in the six months ended October 31, 2025, compared to 72.2%, 17.3% and 10.5% in the six months ended October 31, 2024.
North America – General Tool. Revenues from the sale of rental equipment attributable to the North America – General Tool segment decreased by $33 million, or 18.4%, to $146 million in the six months ended October 31, 2025, from $179 million in the six months ended October 31, 2024.
North America – Specialty. Revenues from the sale of rental equipment attributable to the North America – Specialty segment increased by $1 million, or 2.3%, to $44 million in the six months ended October 31, 2025, from $43 million in the six months ended October 31, 2024.
United Kingdom. Revenues from the sale of rental equipment attributable to the United Kingdom segment decreased by $5 million, or 19.2%, to $21 million in the six months ended October 31, 2025, from $26 million in the six months ended October 31, 2024.
Sales of new equipment, merchandise and consumables. Total revenues from the sale of new equipment, merchandise and consumables increased by $13 million, or 7.1%, to $195 million in the six months ended October 31, 2025, from $182 million in the six months ended October 31, 2024, representing 3.4% and 3.2% of total revenues in the six months ended October 31, 2025 and October 31, 2024, respectively. This increase was primarily due to a higher volume of new equipment sales, which were most pronounced in the North America – Specialty segment.
On a segment basis, revenues from the sale of new equipment, merchandise and consumables attributable to the North America – General Tool, North America – Specialty and United Kingdom segments represented 45.1%, 33.9% and 21.0%, respectively, of total revenues from the sale of rental equipment in the six months ended October 31, 2025, compared to 48.9%, 28.0% and 23.1% in the six months ended October 31, 2024.
North America – General Tool. Revenues from the sale of new equipment, merchandise and consumables attributable to the North America – General Tool segment decreased by $1 million, or 1.1%, to $88 million in the six months ended October 31, 2025, from $89 million in the six months ended October 31, 2024.
North America – Specialty. Revenues from the sale of new equipment, merchandise and consumables attributable to the North America – Specialty segment increased by $15 million, or 29.4%, to $66 million in the six months ended October 31, 2025, from $51 million in the six months ended October 31, 2024.
United Kingdom. Revenues from the sale of new equipment, merchandise and consumables attributable to the United Kingdom segment decreased by $1 million, or 2.4%, to $41 million in the six months ended October 31, 2025, from $42 million in the six months ended October 31, 2024.
Total revenues. For the reasons explained above, total revenues increased by $68 million, or 1.2%, to $5,763 million in the six months ended October, 2025, from $5,695 million in the six months ended October 31, 2024.
Cost of Revenues
Cost of equipment rentals, excluding depreciation. Cost of equipment rentals, excluding depreciation increased by $120 million, or 5.8%, to $2,199 million in the six months ended October 31, 2025, from $2,079 million in the six months ended October 31, 2024. This increase was primarily due to higher costs associated with internal repairs and repositioning of rental fleet to drive utilization improvements.
62
Table of Contents
Depreciation of rental equipment. Depreciation of rental equipment costs increased by $23 million, or 2.6%, to $925 million in the six months ended October 31, 2025, from $902 million in the six months ended October 31, 2024. This increase was primarily due to a larger fleet size and the continued impact of life cycle inflation on our fleet. Depreciation in the North America – General Tool segment (including non-rental depreciation) increased by $19 million, or 2.8%, to $704 million in the six months ended October 31, 2025, from $685 million in the six months ended October 31, 2024. Depreciation in the North America – Specialty segment (including non-rental depreciation) increased by $1 million, or 0.4%, to $268 million in the six months ended October 31, 2025, from $267 million in the six months ended October 31, 2024. Depreciation in the United Kingdom segment (including non-rental depreciation) increased by $4 million, or 4.7%, to $90 million in the six months ended October 31, 2025, from $86 million in the six months ended October 31, 2024, and includes $16 million in non-recurring costs related to the operational restructure of the United Kingdom segment initiated during the six months ended October 31, 2025, of which $11 million related to rental equipment.
Cost of rental equipment sales. Cost of rental equipment sales decreased by $21 million, or 9.9%, to $191 million in the six months ended October 31, 2025, from $212 million in the six months ended October 31, 2024. This decrease was primarily due to the lower volume of used equipment sales in the period, particularly in the North America – General Tool segment, as discussed above. In the North America – General Tool segment, cost of rental equipment sales decreased by $24 million, or 16.0%, to $126 million in the six months ended October 31, 2025, from $150 million in the six months ended October 31, 2024. In the North America – Specialty segment, cost of rental equipment sales increased by $2 million, or 4.4%, to $47 million in the six months ended October 31, 2025, from $45 million in the six months ended October 31, 2024. In the United Kingdom segment, cost of rental equipment sales decreased by $2 million, or 11.8%, to $15 million in the six months ended October 31, 2025, from $17 million in the six months ended October 31, 2024.
Cost of sales of new equipment, merchandise and consumables. Cost of sales of new equipment, merchandise and consumables increased by $13 million, or 12.2%, to $120 million in the six months ended October 31, 2025, from $107 million in the six months ended October 31, 2024. This was primarily due to the higher volume of new equipment sales in the period, as discussed under “—Revenues—Sales of new equipment, merchandise and consumables” above.
Total cost of revenues. For the reasons explained above, total cost of revenues increased by $135 million, or 4.1%, to $3,435 million in the six months ended October 31, 2025, from $3,300 million in the six months ended October 31, 2024.
Selling, General and Administrative Expenses
Selling, general and administrative expenses increased by $89 million, or 12.2%, to $819 million in the six months ended October 31, 2025, from $730 million in the six months ended October 31, 2024. This increase was due predominantly to higher stock-based compensation expenses, which were $34 million in the six months ended October 31, 2025 compared to $3 million in the six months ended October 31, 2024, reflecting stock price fluctuations, as well as costs associated with the Redomiciliation and U.S. Listing and continued investment in the infrastructure of the business to support growth.
Non-rental Depreciation and Amortization
Non-rental depreciation and amortization increased by $16 million, or 7.5%, to $230 million in the six months ended October 31, 2025, from $214 million in the six months ended October 31, 2024. This increase reflects higher depreciation expenses on our non-rental assets, including our delivery vehicle fleet and property, and also includes $5 million in non-recurring costs related to the operational restructure of the United Kingdom segment initiated during the six months ended October 31, 2025.
63
Table of Contents
Interest Expense, Net
Interest expense, net decreased by $29 million, or 13.1%, to $193 million in the six months ended October 31, 2025, from $222 million in the six months ended October 31, 2024. This decrease was primarily due to lower average debt levels during the six months ended October 31, 2025 compared to the six months ended October 31, 2024.
Other Expense (Income), Net
Other expense (income), net decreased by $21 million, or 131.3%, to a net income of $5 million in the six months ended October 31, 2025, from a net expense of $16 million in the six months ended October 31, 2024. This movement was primarily due to adverse movements in the fair value of our equity investments in the prior year which did not reoccur, partially offset by a $7 million loss on the disposal of a business as part of the operational restructure of the United Kingdom segment.
Provision for income taxes
Provision for income taxes decreased by $32 million, or 10.2%, to $282 million in the six months ended October 31, 2025, from $314 million in the six months ended October 31, 2024. This decrease was primarily driven by a decrease in pre-tax income. The effective rates for the six months ended October 31, 2024 and 2025 remained consistent at 26%, approximating the statutory rate of 25%.
Net Income
For the reasons explained above, net income decreased by $90 million, or 10.0%, to $809 million in the six months ended October 31, 2025, from $899 million in the six months ended October 31, 2024.
Fiscal Year Ended April 30, 2025, Compared With Fiscal Year Ended April 30, 2024
Revenues
Equipment rentals. Total equipment rental revenues increased by $350 million, or 3.6%, to $9,980 million in the fiscal year ended April 30, 2025 from $9,630 million in the fiscal year ended April 30, 2024, representing 92.5% and 88.7% of total revenues in the fiscal years ended April 30, 2025 and April 30, 2024, respectively. The increase in total equipment rental revenues arose due to increases in volume (or fleet on rent) and rental rate, although the original cost of our rental fleet increased at a higher rate, in part due to the impact of life cycle inflation on our fleet, which impacted our dollar utilization over the period. In the fiscal year ended April 30, 2025, our dollar utilization was 54%, compared to 56% for the fiscal year ended April 30, 2024. The average original equipment cost of our rental fleet increased by 7.3% in the fiscal year ended April 30, 2025 compared to the fiscal year ended April 30, 2024. See “—Key Financial Metrics—Key Performance Indicators” above for a definition and further information on dollar utilization.
On a segment basis, equipment rental revenues attributable to the North America – General Tool, North America – Specialty and United Kingdom segments represented 59.0%, 33.2% and 7.8%, respectively, of total equipment rental revenues in the fiscal year ended April 30, 2025, compared to 60.5%, 31.8% and 7.7% in the fiscal year ended April 30, 2024.
North America – General Tool. Equipment rental revenues attributable to the North America – General Tool segment increased by $63 million, or 1.1%, to $5,889 million in the fiscal year ended April 30, 2025 from $5,826 million in the fiscal year ended April 30, 2024. This increase was primarily due to a 3.7% increase in the volume of fleet on rent. Included within this activity, we estimate that hurricane response efforts contributed $25 million to $30 million to North America – General Tool equipment rental revenues in the fiscal year ended April 30, 2025. From a customer mix perspective, increased mega project activity has partially mitigated a more
64
Table of Contents
moderate local commercial construction market. The segment’s dollar utilization decreased from 51% for the fiscal year ended April 30, 2024 to 48% for the fiscal year ended April 30, 2025, reflecting the impact of the average original cost of equipment being 7.1% higher, in part due to the impact of life cycle inflation on our fleet, as well as softer local market conditions. New greenfield sites and bolt-on acquisitions, as well as the maturation of greenfield sites opened in the past several years, provided a tailwind for equipment rental revenues in the fiscal year ended April 30, 2025. In the fiscal year ended April 30, 2025, equipment rental revenues attributable to same-store and greenfield sites were stable compared to the fiscal year ended April 30, 2024, while revenues attributable to bolt-on acquisitions since May 1, 2023 contributed 1.4% of equipment rental revenue growth over the same period.
North America – Specialty. Equipment rental revenues attributable to the North America – Specialty segment increased by $251 million, or 8.2%, to $3,313 million in the fiscal year ended April 30, 2025 from $3,062 million in the fiscal year ended April 30, 2024. This increase was primarily due to an 8.1% increase in volume of fleet on rent, particularly in power and cooling equipment. Included within this activity, we estimate that hurricane response efforts contributed $60 million to $70 million to North America – Specialty equipment rental revenues in the fiscal year ended April 30, 2025. The segment’s dollar utilization moderated from 74% to 73%, reflecting the 8.9% higher average original equipment cost of our specialty rental fleet over the period. Specialty rental revenue in the fiscal year ended April 30, 2025 was further bolstered by continued investment in and maturity of greenfield locations added during recent years. In the fiscal year ended April 30, 2025, equipment rental revenues attributable to same-store and greenfield sites increased by 7.6% compared to the fiscal year ended April 30, 2024, while equipment rental revenues attributable to bolt-on acquisitions since May 1, 2023 contributed 0.6% of equipment rental revenue growth over the same period.
United Kingdom. Equipment rental revenues attributable to the United Kingdom segment increased by $36 million, or 4.9%, to $778 million in the fiscal year ended April 30, 2025 from $742 million in the fiscal year ended April 30, 2024. This increase was primarily due to a combination of both rate and volume of fleet on rent improvement, with fleet on rent 2.4% higher in the fiscal year ended April 30, 2025 compared with the fiscal year ended April 30, 2024.
Sales of rental equipment. Total revenues from the sale of rental equipment decreased by $392 million, or 45.6%, to $467 million in the fiscal year ended April 30, 2025 from $859 million in the fiscal year ended April 30, 2024, representing 4.3% and 7.9% of total revenues in the fiscal years ended April 30, 2025 and April 30, 2024, respectively. This decrease in sales of rental equipment reflects a lower volume of used equipment disposals compared to the fiscal year ended April 30, 2024, during which we took advantage of favorable pricing conditions, as well as opportunities to catch up on fleet replacement in the fiscal year ended April 30, 2024 that had been deferred due to supply chain constraints during the COVID-19 pandemic.
On a segment basis, revenues from the sale of rental equipment attributable to the North America – General Tool, North America – Specialty and United Kingdom segments represented 72.4%, 16.9% and 10.7%, respectively, of total revenues from the sale of rental equipment in the fiscal year ended April 30, 2025, compared to 83.9%, 8.5% and 7.6% in the fiscal year ended April 30, 2024.
North America – General Tool. Revenues from the sale of rental equipment attributable to the North America – General Tool segment decreased by $383 million, or 53.1%, to $338 million in the fiscal year ended April 30, 2025, from $721 million in the fiscal year ended April 30, 2024.
North America – Specialty. Revenues from the sale of rental equipment attributable to the North America – Specialty segment increased by $6 million, or 8.2%, to $79 million in the fiscal year ended April 30, 2025, from $73 million in the fiscal year ended April 30, 2024.
United Kingdom. Revenues from the sale of rental equipment attributable to the United Kingdom segment decreased by $15 million, or 23.1%, to $50 million in the fiscal year ended April 30, 2025, from $65 million in the fiscal year ended April 30, 2024.
65
Table of Contents
Sales of new equipment, merchandise and consumables. Total revenues from the sale of new equipment, merchandise and consumables decreased by $26 million, or 7.0%, to $344 million in the fiscal year ended April 30, 2025, from $370 million in the fiscal year ended April 30, 2024, representing 3.2% and 3.4% of total revenues in the fiscal years ended April 30, 2025 and April 30, 2024, respectively. This decrease was primarily due to a lower volume of new equipment sales in the fiscal year ended April 30, 2025, which were most pronounced in the North America – Specialty segment.
On a segment basis, revenues from the sale of new equipment, merchandise and consumables attributable to the North America – General Tool, North America – Specialty and United Kingdom segments represented 49.4%, 27.6% and 23.0%, respectively, of total revenues from the sale of rental equipment in the fiscal year ended April 30, 2025, compared to 47.0%, 31.1% and 21.9% in the fiscal year ended April 30, 2024.
North America – General Tool. Revenues from the sale of new equipment, merchandise and consumables attributable to the North America – General Tool segment decreased by $4 million, or 2.3%, to $170 million in the fiscal year ended April 30, 2025, from $174 million in the fiscal year ended April 30, 2024.
North America – Specialty. Revenues from the sale of new equipment, merchandise and consumables attributable to the North America – Specialty segment decreased by $20 million, or 17.4%, to $95 million in the fiscal year ended April 30, 2025, from $115 million in the fiscal year ended April 30, 2024.
United Kingdom. Revenues from the sale of new equipment, merchandise and consumables attributable to the United Kingdom segment decreased by $2 million, or 2.5%, to $79 million in the fiscal year ended April 30, 2025, from $81 million in the fiscal year ended April 30, 2024.
Total revenues. For the reasons explained above, total revenues decreased by $68 million, or 0.6%, to $10,791 million in the fiscal year ended April 30, 2025, from $10,859 million in the fiscal year ended April 30, 2024.
Cost of Revenues
Cost of equipment rentals, excluding depreciation. Cost of equipment rentals, excluding depreciation increased by $195 million, or 5.0%, to $4,069 million in the fiscal year ended April 30, 2025, from $3,874 million in the fiscal year ended April 30, 2024. This increase was primarily due to increases in delivery and collection costs related to equipment going on and coming off rent, increases in costs to repair our equipment, and increases in costs related to ancillary revenues.
Depreciation of rental equipment. Depreciation of rental equipment costs increased by $162 million, or 9.8%, to $1,815 million in the fiscal year ended April 30, 2025, from $1,653 million in the fiscal year ended April 30, 2024. This increase was primarily due to a larger average equipment fleet size in the fiscal year ended April 30, 2025, which increased 7.3% compared to the fiscal year ended April 30, 2024, and was primarily attributable to a $125 million, or 9.9%, increase in depreciation in the North America – General Tool segment (including non-rental depreciation) to $1,384 million in the fiscal year ended April 30, 2025, from $1,259 million in the fiscal year ended April 30, 2024. Depreciation in the North America – Specialty segment (including non-rental depreciation) increased by $69 million, or 14.7%, to $539 million in the fiscal year ended April 30, 2025, from $470 million in the fiscal year ended April 30, 2024. Depreciation in the United Kingdom segment (including non-rental depreciation) increased by $7 million, or 4.3%, to $171 million in the fiscal year ended April 30, 2025, from $164 million in the fiscal year ended April 30, 2024.
Cost of rental equipment sales. Cost of rental equipment sales decreased by $250 million, or 39.3%, to $386 million in the fiscal year ended April 30, 2025, from $636 million in the fiscal year ended April 30, 2024. This decrease was primarily due to a lower volume of rental equipment sales in the fiscal year ended April 30, 2025, as discussed above, particularly in the North America – General Tool segment, where cost of rental equipment sales decreased by $250 million, or 47.2%, to $280 million in the fiscal year ended April 30, 2025,
66
Table of Contents
from $530 million in the fiscal year ended April 30, 2024. This was partially offset by a $7 million, or 10.6%, increase in cost of rental equipment sales in the North America – Specialty segment to $73 million in the fiscal year ended April 30, 2025, from $66 million in the fiscal year ended April 30, 2024. In the United Kingdom segment, cost of rental equipment sales decreased by $7 million, or 17.5%, to $33 million in the fiscal year ended April 30, 2025, from $40 million in the fiscal year ended April 30, 2024.
Cost of sales of new equipment, merchandise and consumables. Cost of sales of new equipment, merchandise and consumables decreased by $18 million, or 8.2%, to $201 million in the fiscal year ended April 30, 2025, from $219 million in the fiscal year ended April 30, 2024. This was primarily due to a lower volume of new equipment sales in the fiscal year ended April 30, 2025, as discussed under “—Revenues—Sales of new equipment, merchandise and consumables” above.
Total cost of revenues. For the reasons explained above, total cost of revenues increased by $89 million, or 1.4%, to $6,471 million in the fiscal year ended April 30, 2025, from $6,382 million in the fiscal year ended April 30, 2024.
Selling, General and Administrative Expenses
Selling, general and administrative expenses decreased by $187 million, or 11.9%, to $1,385 million in the fiscal year ended April 30, 2025, from $1,572 million in the fiscal year ended April 30, 2024. This decrease was due predominantly to decreases in the year-over-year impact of share-based compensation given stock price fluctuations, coupled with the resolution of the bankruptcy of a customer in the fiscal year ended April 30, 2024.
Non-rental Depreciation and Amortization
Non-rental depreciation and amortization increased by $42 million, or 10.7%, to $436 million in the fiscal year ended April 30, 2025, from $394 million in the fiscal year ended April 30, 2024. This increase was primarily due to higher depreciation expense on non-rental equipment, including delivery vehicles, land and buildings, and increased amortization of right-of-use assets.
Interest Expense, Net
Interest expense, net decreased by $3 million, or 0.7%, to $425 million in the fiscal year ended April 30, 2025, from $428 million in the fiscal year ended April 30, 2024. This decrease was primarily due to reduced overall debt levels, as we repaid certain amounts outstanding under our ABL Facility, in combination with a lower average interest rate under the ABL Facility (5.242%, compared to 6.853% in the fiscal year ended April 30, 2024). This was, however, primarily offset by higher interest payable on our Senior Notes and lease obligations, as well as increased non-cash unwind of discount on liabilities and amortization of deferred debt raising costs.
Other Expense (Income), Net
Other expense (income), net increased by $15 million, or 136.4%, to a net expense of $4 million in the fiscal year ended April 30, 2025, from a net income of $11 million in the fiscal year ended April 30, 2024. This movement was primarily due to changes in fair value of our equity investments.
Provision for income taxes
Provision for income taxes decreased by $5 million, or 1.0%, to $517 million in the fiscal year ended April 30, 2025, from $522 million in the fiscal year ended April 30, 2024. This decrease was primarily driven by a decrease in pre-tax income and changes in key book-to-tax differences, such as depreciation, amortization, and accruals. The effective rates for the fiscal years ended April 30, 2025 and 2024, respectively, remained consistent, approximating the statutory rate of 25%.
67
Table of Contents
Net Income
For the reasons explained above, net income decreased by $19 million, or 1.2%, to $1,553 million in the fiscal year ended April 30, 2025, from $1,572 million in the fiscal year ended April 30, 2024.
Fiscal Year Ended April 30, 2024, Compared With Fiscal Year Ended April 30, 2023
Revenues
Equipment rentals. Total equipment rental revenues increased by $932 million, or 10.7%, to $9,630 million in the fiscal year ended April 30, 2024 from $8,698 million in the fiscal year ended April 30, 2023, representing 88.7% and 90.0% of total revenues in the fiscal years ended April 30, 2024 and April 30, 2023, respectively. The increase in total equipment rental revenues arose due to increases in volume and rental rate, which impacted our dollar utilization. In the fiscal year ended April 30, 2024, our dollar utilization was 56%, compared to 60% for the fiscal year ended April 30, 2023. The average original equipment cost of our rental fleet increased by 17.0% in the fiscal year ended April 30, 2024 compared to the fiscal year ended April 30, 2023. See “—Key Financial Metrics—Key Performance Indicators” above for a definition and further information on dollar utilization.
On a segment basis, equipment rental revenues attributable to the North America – General Tool, the North America – Specialty and the United Kingdom segments represented 60.5%, 31.8% and 7.7%, respectively, of total equipment rental revenues in the fiscal year ended April 30, 2024, compared to 60.8%, 31.4% and 7.7% in the fiscal year ended April 30, 2023.
North America – General Tool. Equipment rental revenues attributable to the North America – General Tool segment increased by $534 million, or 10.1%, to $5,826 million in the fiscal year ended April 30, 2024, from $5,292 million in the fiscal year ended April 30, 2023. This increase was primarily due to a 10.1% increase in the volume of fleet on rent, as end markets remained strong throughout the fiscal year ended April 30, 2024. The segment’s dollar utilization decreased from 53% for the fiscal year ended April 30, 2023 to 51% for the fiscal year ended April 30, 2024, reflecting the impact of the 14.4% increase in the average original cost of our rental fleet over the period as fleet utilization levels moderated to more normalized levels. Additionally, new greenfield sites and bolt-on acquisitions, as well as the maturation of greenfield sites opened in the past several years, were a tailwind to equipment rental revenues in the fiscal year ended April 30, 2024. In the fiscal year ended April 30, 2024, equipment rental revenues attributable to same-store and greenfield sites increased 5.5%, while equipment rental revenues attributable to bolt-on acquisitions since May 1, 2022 contributed a further 4.6% to equipment rental revenue growth between the fiscal year ended April 30, 2023 and the fiscal year ended April 30, 2024.
North America – Specialty. Equipment rental revenues attributable to the North America – Specialty segment increased by $328 million, or 12.0%, to $3,062 million in the fiscal year ended April 30, 2024, from $2,734 million in the fiscal year ended April 30, 2023. This increase was primarily due to an increased scope and breadth of services provided by the North America – Specialty segment and strong market conditions yielding a 17.1% higher volume of fleet on rent. The segment’s dollar utilization moderated from 84% to 74%, reflecting the impact of the increased average original cost of our rental fleet over the period of 26.5%, offset by lower utilization of fleet as utilization levels normalized. Equipment rental revenues attributable to same-store and greenfield sites increased by 8.3% between the fiscal year ended April 30, 2023 and the fiscal year ended April 30, 2024, while equipment rental revenues attributable to bolt-on acquisitions since May 1, 2022 contributed a further 3.7% to equipment rental revenue growth over the same period.
United Kingdom. Equipment rental revenues attributable to the United Kingdom segment increased by $70 million, or 10.4%, to $742 million in the fiscal year ended April 30, 2024 from $672 million in the fiscal year ended April 30, 2023. This increase was primarily due to a combination of rate and volume of fleet on rent improvement, with fleet on rent 11.6% higher in the fiscal year ended April 30, 2024, compared with the fiscal year ended April 30, 2023. Dollar utilization in the segment remained constant at 53% over the period.
68
Table of Contents
Sales of rental equipment. Total revenues from the sale of rental equipment increased by $232 million, or 37.0%, to $859 million in the fiscal year ended April 30, 2024, from $627 million in the fiscal year ended April 30, 2023, representing 7.9% and 6.5% of total revenues in the fiscal years ended April 30, 2024 and April 30, 2023, respectively. This increase was primarily due to the deferral of equipment sales from the fiscal year ended April 30, 2023 to the fiscal year ended April 30, 2024 due to the effects of the pandemic, as well as to harness favorable market conditions relative to secondhand values of our equipment. These decisions were made across all three of our operating segments in the fiscal year ended April 30, 2024.
On a segment basis, revenues from the sale of rental equipment attributable to the North America – General Tool, North America – Specialty and United Kingdom segments represented 83.9%, 8.5% and 7.6%, respectively, of total revenues from the sale of rental equipment in the fiscal year ended April 30, 2024, compared to 81.7%, 8.5% and 9.9% in the fiscal year ended April 30, 2023.
North America – General Tool. Revenues from the sale of rental equipment attributable to the North America – General Tool segment increased by $209 million, or 40.8%, to $721 million in the fiscal year ended April 30, 2024, from $512 million in the fiscal year ended April 30, 2023.
North America – Specialty. Revenues from the sale of rental equipment attributable to the North America – Specialty segment increased by $20 million, or 37.7%, to $73 million in the fiscal year ended April 30, 2024, from $53 million in the fiscal year ended April 30, 2023.
United Kingdom. Revenues from the sale of rental equipment attributable to the United Kingdom segment increased by $3 million, or 4.8%, to $65 million in the fiscal year ended April 30, 2024, from $62 million in the fiscal year ended April 30, 2023.
Sales of new equipment, merchandise and consumables. Total revenues from the sale of new equipment, merchandise and consumables increased by $28 million, or 8.2%, to $370 million in the fiscal year ended April 30, 2024, from $342 million in the fiscal year ended April 30, 2023, representing 3.4% and 3.5% of total revenues in the fiscal years ended April 30, 2024 and April 30, 2023, respectively. This was primarily due to higher new equipment sales in the fiscal year ended April 30, 2024, which were most pronounced in the North America – Specialty segment.
On a segment basis, revenues from the sale of new equipment, merchandise and consumables attributable to the North America – General Tool, the North America – Specialty and the United Kingdom segments represented 47.0%, 31.1% and 21.9%, respectively, of total revenues from the sale of rental equipment in the fiscal year ended April 30, 2024, compared to 44.4%, 29.5% and 26.0% in the fiscal year ended April 30, 2023.
North America – General Tool. Revenues from the sale of new equipment, merchandise and consumables attributable to the North America – General Tool segment increased by $22 million, or 14.5%, to $174 million in the fiscal year ended April 30, 2024, from $152 million in the fiscal year ended April 30, 2023.
North America – Specialty. Revenues from the sale of new equipment, merchandise and consumables attributable to the North America – Specialty segment increased by $14 million, or 13.9%, to $115 million in the fiscal year ended April 30, 2024, from $101 million in the fiscal year ended April 30, 2023.
United Kingdom. Revenues from the sale of new equipment, merchandise and consumables attributable to the United Kingdom segment decreased by $8 million, or 9.0%, to $81 million in the fiscal year ended April 30, 2024, from $89 million in the fiscal year ended April 30, 2023. This decrease principally reflects higher level of ancillary sales revenue in the fiscal year ended April 30, 2023, associated with the demobilization of the U.K. Department of Health and Social Care’s COVID-19 testing sites and Queen Elizabeth’s funeral.
Total revenues. For the reasons explained above, total revenues increased by $1,192 million, or 12.3%, to $10,859 million in the fiscal year ended April 30, 2024, from $9,667 million in the fiscal year ended April 30, 2023.
69
Table of Contents
Cost of Revenues
Cost of equipment rentals, excluding depreciation. Cost of revenues increased by $371 million, or 10.6%, to $3,874 million in the fiscal year ended April 30, 2024, from $3,503 million in the fiscal year ended April 30, 2023. This increase was primarily due to increases in delivery and collection costs related to equipment rentals, increases in costs to repair our equipment, increases in costs related to salaries and increases in direct costs related to ancillary revenues.
Depreciation of rental equipment. Depreciation of rental equipment costs increased by $260 million, or 18.7%, to $1,653 million in the fiscal year ended April 30, 2024, from $1,393 million in the fiscal year ended April 30, 2023. This increase was primarily due to a larger average equipment fleet size in the fiscal year ended April 30, 2024, which increased 17.0% compared to the fiscal year ended April 30, 2023. Depreciation in the North America – General Tool segment and in the North America – Specialty segment (including non-rental depreciation) increased by 17.7% and 28.8%, respectively, to $1,259 million and $470 million, respectively, in the fiscal year ended April 30, 2025 from $1,070 million and $365 million, respectively, in the fiscal year ended April 30, 2024. Depreciation in the United Kingdom segment (including non-rental depreciation) also increased by $22 million, or 15.5%, to $164 million in the fiscal year ended April 30, 2025, from $142 million in the fiscal year ended April 30, 2024.
Cost of rental equipment sales. Cost of rental equipment sales increased by $194 million, or 43.9%, to $636 million in the fiscal year ended April 30, 2024, from $442 million in the fiscal year ended April 30, 2023. This increase was primarily due to a higher volume of rental equipment sales in the fiscal year ended April 30, 2024, as discussed above, which contributed to increased cost of equipment rental sales in all three of our operating segments. In the North America – General Tool segment, cost of rental equipment sales increased by $170 million, or 47.2%, to $530 million in the fiscal year ended April 30, 2024, from $360 million in the fiscal year ended April 30, 2023. In the North America – Specialty segment, cost of rental equipment sales increased by $22 million, or 50.0%, to $66 million in the fiscal year ended April 30, 2024, from $44 million in the fiscal year ended April 30, 2023. In the United Kingdom segment, cost of rental equipment sales increased by $2 million, or 5.3%, to $40 million in the fiscal year ended April 30, 2024, from $38 million in the fiscal year ended April 30, 2023.
Cost of sales of new equipment, merchandise and consumables. Cost of sales of new equipment, merchandise and consumables increased by $18 million, or 9.0%, to $219 million in the fiscal year ended April 30, 2024 from $201 million in the fiscal year ended April 30, 2023. This was primarily due to a higher volume of new equipment sales in the fiscal year ended April 30, 2024, as discussed under “—Revenues—Sales of new equipment, merchandise and consumables” above.
Total cost of revenues. For the reasons explained above, total cost of revenues increased by $843 million, or 15.2%, to $6,382 million in the fiscal year ended April 30, 2024, from $5,539 million in the fiscal year ended April 30, 2023.
Selling, General and Administrative Expenses
Selling, general and administrative expenses increased by $224 million, or 16.6%, to $1,572 million in the fiscal year ended April 30, 2024, from $1,348 million in the fiscal year ended April 30, 2023. This increase was primarily due to an increased investment in the business, a provision related to the bankruptcy of a customer in the fiscal year ended April 30, 2024, as well as general inflationary market dynamics, particularly related to labor costs.
Non-rental Depreciation and Amortization
Non-rental depreciation and amortization increased by $60 million, or 18.0%, to $394 million in the fiscal year ended April 30, 2024, from $334 million in the fiscal year ended April 30, 2023. This increase was primarily due to a higher depreciation expense on non-rental equipment, including delivery vehicles, land and buildings, and increased amortization of right-of-use assets.
70
Table of Contents
Interest Expense, Net
Interest expense, net increased by $153 million, or 55.6%, to $428 million in the fiscal year ended April 30, 2024, from $275 million in the fiscal year ended April 30, 2023. This increase was primarily due to higher average debt levels coupled with a higher interest rate environment for the fiscal year ended April 30, 2024 compared to the fiscal year ended April 30, 2023.
Other Expense (Income), Net
Other expense (income), net decreased by $30 million, or 157.9%, to a net income of $11 million in the fiscal year ended April 30, 2024, from a net expense of $19 million in the fiscal year ended April 30, 2023. This change was primarily due to changes in fair value of our equity investments.
Provision for income taxes
Provision for income taxes decreased by $25 million, or 4.6%, to $522 million in the fiscal year ended April 30, 2024, from $547 million in the fiscal year ended April 30, 2023. This decrease was primarily driven by a decrease in pre-tax income and changes in key book-to-tax differences, such as depreciation, amortization, and accruals. The effective rates for the fiscal years ended April 30, 2023 and 2024, respectively, remained consistent, approximating the statutory rate of 25%.
Net Income
For the reasons explained above, net income decreased by $33 million, or 2.1%, to $1,572 million in the fiscal year ended April 30, 2024, from $1,605 million in the fiscal year ended April 30, 2023.
Liquidity and Capital Resources
Sources and Uses of Cash
Our primary existing sources of liquidity are (i) cash generated from operations, (ii) cash generated from sales of tangible fixed assets (primarily used rental equipment), and (iii) borrowings available under our ABL Facility.
We anticipate that our principal short-term (over the next 12 months) and long-term needs for cash relating to our operations will be to fund (i) payment of operating expenses, (ii) purchases of rental equipment and inventory items offered for sale, (iii) servicing and repayment of debt, (iv) acquisitions, (v) payment of dividends, and (vi) share repurchases. We plan to fund such cash requirements primarily using borrowings available under our ABL Facility. However, we may also seek additional financing through, for example, the issuance of equity, debt securities and/or other borrowings.
As of October 31, 2025, we had cash and cash equivalents of $40 million (of which $7 million was held in Canadian dollars and $15 million in British pounds) and an available borrowing amount of $3,431 million under our ABL Facility. We believe that our existing sources of cash, primarily through our ABL Facility, will be sufficient to support our liquidity and capital requirements over the next 12 months.
71
Table of Contents
Cash Flows
The table below presents a summary of our cash flows for the periods indicated.
| ($ in millions) | Six months ended October 31, | Fiscal year ended April 30, | ||||||||||||||||||
| 2025 | 2024 | 2025 | 2024 | 2023 | ||||||||||||||||
| Net cash provided by operating activities |
1,865 | 1,938 | 3,844 | 3,664 | 3,346 | |||||||||||||||
| Net cash used in investing activities |
(962 | ) | (1,632 | ) | (2,318 | ) | (4,428 | ) | (4,018 | ) | ||||||||||
| Net cash (used in) provided by financing activities |
(884 | ) | (303 | ) | (1,526 | ) | 755 | 688 | ||||||||||||
| Effect of exchange rate changes on cash and cash equivalents |
— | — | — | — | (1 | ) | ||||||||||||||
| Net (decrease) increase in cash and cash equivalents |
19 | 3 | — | (9 | ) | 15 | ||||||||||||||
| Cash and cash equivalents at the beginning of the period |
21 | 21 | 21 | 30 | 15 | |||||||||||||||
|
|
|
|
|
|
|
|
|
|
|
|||||||||||
| Cash and cash equivalents at the end of the period |
40 | 24 | 21 | 21 | 30 | |||||||||||||||
Cash Flows from Operating Activities
Net cash inflow from operating activities decreased by $73 million, or 3.8%, to $1,865 million in the six months ended October 31, 2025, from $1,938 million in the six months ended October 31, 2024, primarily due to decreases in net income and increases in accounts receivable, which were $286 million in the six months ended October 31, 2025 compared to $183 million in the six months ended October 31, 2024.
Net cash inflow from operating activities increased by $180 million, or 4.9%, to $3,844 million in the fiscal year ended April 30, 2025, from $3,664 million in the fiscal year ended April 30, 2024, primarily due to increases in year-over-year cash flow associated with decreases in accounts receivable.
Net cash inflow from operating activities increased by $318 million, or 9.5%, to $3,664 million in the fiscal year ended April 30, 2024, from $3,346 million in the fiscal year ended April 30, 2023, primarily due to increases in net income.
Cash Flows from Investing Activities
Net cash outflow from investing activities decreased by $670 million, or 41.1%, to $962 million in the six months ended October 31, 2025, from $1,632 million in the six months ended October 31, 2024, primarily due to a reduction in payments for purchases of rental equipment, which were $872 million in the six months ended October 31, 2025 compared to $1,518 million in the six months ended October 31, 2024.
Net cash outflow from investing activities decreased by $2,110 million, or 47.7%, to $2,318 million in the fiscal year ended April 30, 2025, from $4,428 million in the fiscal year ended April 30, 2024, primarily due to decreases in cash used to purchase rental equipment and decreases in cash utilized to acquire businesses.
Net cash outflow from investing activities increased by $410 million, or 10.2%, to $4,428 million in the fiscal year ended April 30, 2024, from $4,018 million in the fiscal year ended April 30, 2023, primarily due to increases in cash used to purchase rental equipment.
Cash Flows from Financing Activities
Net cash outflow from financing activities increased by $581 million, or 191.8%, to $884 million in the six months ended October 31, 2025, from $303 million in the six months ended October 31, 2024, primarily
72
Table of Contents
attributable to $714 million spent on share repurchases under the buyback program launched in December 2024 during the six months ended October 31, 2025, for which there were no comparable outflows in the six months ended October 31, 2024.
Net cash outflow from financing activities increased by $2,281 million, or 302.1%, to $1,526 million in the fiscal year ended April 30, 2025, from a net inflow of $755 million in the fiscal year ended April 30, 2024, primarily due to an increase in debt arising from the purchase of rental equipment.
Net cash inflow from financing activities increased by $67 million, or 9.7%, to $755 million in the fiscal year ended April 30, 2024, from $688 million in the fiscal year ended April 30, 2023, primarily due to increased proceeds from debt from the increased purchases of rental equipment mitigated by decreases in the share buyback program.
Borrowings
The table below presents a breakdown of the amounts outstanding under our interest-bearing loans and borrowings as of the dates indicated.
| ($ in millions) | As of October 31, | As of April 30, | ||||||||||||||||||
| 2025 | 2024 | 2025 | 2024 | 2023 | ||||||||||||||||
| ABL Facility |
1,522 | 2,035 | 1,346 | 1,848 | 2,038 | |||||||||||||||
| 2026 Senior Notes |
549 | 548 | 549 | 548 | 547 | |||||||||||||||
| 2027 Senior Notes |
598 | 597 | 598 | 597 | 596 | |||||||||||||||
| 2028 Senior Notes |
597 | 597 | 597 | 596 | 595 | |||||||||||||||
| 2029 Senior Notes |
596 | 596 | 596 | 595 | 594 | |||||||||||||||
| 2031 Senior Notes |
746 | 745 | 745 | 745 | 744 | |||||||||||||||
| 2032 Senior Notes |
741 | 739 | 740 | 739 | 738 | |||||||||||||||
| 2033(I) Senior Notes |
744 | 744 | 744 | 743 | 743 | |||||||||||||||
| 2033(II) Senior Notes |
745 | 744 | 744 | 744 | — | |||||||||||||||
| 2034 Senior Notes |
842 | 841 | 841 | 840 | — | |||||||||||||||
|
|
|
|
|
|
|
|
|
|
|
|||||||||||
| Total |
7,680 | 8,186 | 7,500 | 7,995 | 6,595 | |||||||||||||||
|
|
|
|
|
|
|
|
|
|
|
|||||||||||
First Priority Senior Secured Credit Facility (ABL Facility)
Ashtead, as guarantor, and certain of Ashtead’s subsidiaries, as borrowers and/or guarantors, are parties to the ABL Facility Agreement, which is an asset-based, non-amortizing, senior secured revolving credit facility agreement. In November 2024, we agreed with the lenders listed below on certain amendments to the ABL Facility Agreement, including to (i) increase the total commitments under the available facility to $4.75 billion (of which up to $1 billion U.S. dollar equivalent can be drawn in British pounds and $1 billion U.S. dollar equivalent can be drawn in Canadian dollars), (ii) extend the maturity date from August 2026 to November 2029 and (iii) amend the pricing, as further described below. On December 24, 2025, Ashtead and the lenders agreed to further amend certain provisions under the ABL Facility Agreement in contemplation of the Redomiciliation. Upon the consummation of the Redomiciliation, the Company is expected to become party to the ABL Facility Agreement, as borrower representative and an additional guarantor.
Lenders. Bank of America, N.A., Regions Bank, First Horizon Bank, Bank of Montreal, Chicago Branch, Bank of Montreal, Bank of Montreal, London Branch, National Westminster Bank Plc, BARCLAYS BANK PLC, TD Bank, N.A., PNC BANK, NATIONAL ASSOCIATION, TRUIST BANK, U.S. BANK NATIONAL ASSOCIATION, CITY NATIONAL BANK, LLOYDS BANK PLC, JPMorgan Chase Bank, N.A., JPMorgan Chase Bank, N.A., Toronto Branch, SUMITOMO MITSUI BANKING CORPORATION, The Huntington National Bank, a national banking association, Apple Bank, HSBC Bank USA, N.A., HSBC UK Bank Plc, WELLS FARGO BANK, NATIONAL ASSOCIATION, WELLS FARGO CAPITAL FINANCE (UK) LIMITED, WELLS FARGO CAPITAL FINANCE CORPORATION CANADA, BNP PARIBAS, MIZUHO BANK, LTD., and Webster Bank, National Association.
73
Table of Contents
First Priority Security. Our obligations under the ABL Facility Agreement are secured by a first priority security interest, subject to permitted liens and other limited exceptions, in substantially all tangible and intangible property of the borrowers and the guarantors at any time owned or acquired. Each new material subsidiary of the Company is required to promptly provide security over its assets, subject to permitted liens and other limited exceptions.
Available Funds. As the ABL Facility Agreement is asset-based, the maximum amount available to be borrowed (which includes drawings in the form of standby letters of credit) depends on asset values (receivables, inventory and rental equipment), which are subject to periodic independent appraisal. Our ability to borrow, repay and reborrow revolving loans and have letters of credit issued for our accounts is limited by, among other things, U.S., U.K., and Canadian borrowing bases equal to specified percentages of, among other things, eligible accounts receivable, eligible inventory and eligible rental equipment and is subject to other conditions to borrowing and limitations, including reserve requirements and limitations on the value of certain assets comprising the borrowing bases. As of October 31, 2025 and April 30, 2025, the amount utilized under our ABL Facility was $1,527 million and $1,351 million, respectively (including letters of credit totaling $5 million and $5 million, respectively). The available borrowing amount under the ABL Facility as of the same dates was $3,431 million and $3,616 million, respectively. The financial covenant (see “—Covenants” below) was not tested as of October 31, 2025 or 2024 or as of April 30, 2025, 2024 or 2023 and is unlikely to be measured again in forthcoming quarters.
Pricing. Pricing for the ABL Facility is based on a grid which varies, depending on average quarterly availability, from the applicable benchmark interest rate plus 125 basis points to the applicable benchmark interest rate plus 137.5 basis points (or from the base rate, based among other things on Bank of America’s prime rate, plus 25 basis points to the base rate plus 37.5 basis points). The interest rates currently applicable to this variable rate debt are term SOFR for U.S. dollar loans, SONIA for British pound loans and term CORRA for Canadian dollar loans, as applicable to the currency borrowed, in each case plus 125 basis points. We are able to elect for term SOFR and term CORRA loans interest periods of one, three or six months. The applicable interest rate will rise by 2.0% per annum on any principal amount that is not paid when due, on the principal amount of all obligations under the facility upon the commencement by or against any borrower of an insolvency proceeding and with respect to the principal amount of any protective agent advances. Among other fees, the ABL Facility is also subject to a per annum unused line fee on the undrawn portion of the ABL Facility of 25 basis points, payable quarterly in arrears.
Covenants. The ABL Facility Agreement contains representations and warranties customary for facilities of this type. It also contains a springing financial covenant to maintain a minimum fixed charge coverage ratio of 1.0x, which is the ratio of (i) consolidated EBITDA minus, to the extent positive, consolidated net capital expenditures for the then ended four fiscal quarter period to (ii) fixed charges for such four fiscal quarter period. This financial covenant does not, however, apply when excess availability exceeds 10% of total revolving commitments under the ABL Facility. As of each of October 31, 2025 and April 30, 2025, the threshold was $475 million and our excess availability under the ABL Facility exceeded this amount on each date (accordingly, this covenant was not tested as of each such date). In addition to the financial covenant, the ABL Facility Agreement also contains certain other restrictive or negative covenants, including negative covenants that restrict the ability of each borrower, each guarantor and any restricted subsidiary of the foregoing, subject to important exceptions, to, among other things: (i) merge, reorganize, consolidate or amalgamate with any person or entity; (ii) make investments or loans or acquire any person or entity; (iii) create, incur, assume, guarantee or suffer to exist any debt; (iv) enter into, or be party to any transaction with, any affiliate or stockholder; (v) create or suffer to exist any lien or encumbrance on any of its assets or property; (vi) make payments in connection with subordinated debt or amend or modify the terms of indentures or certain other debt documents; (vii) declare, pay or make distributions or dividends; (viii) sell, assign, lease, consign or otherwise dispose of any of its assets or property; or (ix) engage in any new business.
Events of Default. The ABL Facility Agreement contains certain events of default, subject to certain thresholds and cure rights, including, among other things: (i) non-payment of any amount due; (ii) breach of any representation, warranty or other written statement made or furnished or when reaffirmed by any borrower or any
74
Table of Contents
guarantor; (iii) breaches of covenants; (iv) any event of default on the part of any obligor under any agreement relating to any debt in excess of the greater of 2.0% of consolidated tangible assets or $380 million, if the payment or maturity of such debt may be accelerated or demand for payment may be made in consequence thereof; (v) the borrowers and guarantors shall cease to be solvent (on a consolidated basis); (vi) any action, case or proceeding is commenced by or against any borrower or guarantor, or any agreement of any borrower or guarantor, for (A) the entry of an order for relief under any chapter of the U.S. Bankruptcy Code or other insolvency or debt adjustment law (whether state, federal or foreign), (B) the appointment of a receiver, trustee, liquidator or other custodian for any borrower or guarantor or any part of its assets, (C) an assignment or trust mortgage for the benefit of creditors of any borrower or guarantor or (D) the liquidation, dissolution or winding up of the affairs of any borrower or guarantor; (vii) any “Change of Control” (as defined in the ABL Facility Agreement); and (viii) one or more judgments or orders for the payment of money (not covered by insurance) against any borrower or any guarantor in an amount (net of any applicable insurance recoveries) that exceeds, individually or in the aggregate, the greater of 2.0% of consolidated tangible assets or $380 million.
Senior Notes
As of October 31, 2025, Ashtead, through its wholly-owned subsidiary Ashtead Capital, Inc. (the Notes Issuer), had nine series of senior notes outstanding (collectively, the Senior Notes), all of which were admitted to trading on the LSE’s International Securities Market. Upon the consummation of the Redomiciliation, Sunbelt Rentals is expected to become a guarantor under the Senior Notes.
Other than the terms set out in the following table, and as described below, the Senior Notes have been issued on substantially similar terms.
| Senior Notes |
Principal Amount Issued |
Issue Date | Maturity | Interest Rate (per annum) |
Coupon Dates | |||||||||||||||
| 2026 Senior Notes |
$ | 550 million | Aug 12, 2021 | Aug 12, 2026 | 1.500 | % | Feb 12; Aug 12 | |||||||||||||
| 2027 Senior Notes |
$ | 600 million | Aug 9, 2017 | Aug 15, 2027 | 4.375 | % | Feb 15; Aug 15 | |||||||||||||
| 2028 Senior Notes |
$ | 600 million | Nov 4, 2019 | May 1, 2028 | 4.000 | % | May 1; Nov 1 | |||||||||||||
| 2029 Senior Notes |
$ | 600 million | Nov 4, 2019 | Nov 1, 2029 | 4.250 | % | May 1; Nov 1 | |||||||||||||
| 2031 Senior Notes |
$ | 750 million | Aug 12, 2021 | Aug 12, 2031 | 2.450 | % | Feb 12; Aug 12 | |||||||||||||
| 2032 Senior Notes |
$ | 750 million | Aug 11, 2022 | Aug 11, 2032 | 5.500 | % | Feb 11; Aug 11 | |||||||||||||
| 2033(I) Senior Notes |
$ | 750 million | Jan 30, 2023 | May 30, 2033 | 5.550 | % | May 30; Nov 30 | |||||||||||||
| 2033(II) Senior Notes |
$ | 750 million | Jul 27, 2023 | Oct 15, 2033 | 5.950 | % | Apr 15; Oct 15 | |||||||||||||
| 2034 Senior Notes |
$ | 850 million | Jan 29, 2024 | Apr 15, 2034 | 5.800 | % | Apr 15; Oct 15 | |||||||||||||
Ranking. All Senior Notes: (i) rank senior in right of payment to all of the Notes Issuer’s existing and future debt that is subordinated in right of payment to the relevant Senior Notes; (ii) rank equally in right of payment with all of the Notes Issuer’s existing and future debt that is not subordinated in right of payment of the relevant Senior Notes (including all other Senior Notes); and (iii) rank effectively subordinated to existing and future secured debt, including the ABL Facility, to the extent of the value of the collateral securing such debt, and structurally subordinated to all liabilities of our subsidiaries that do not guarantee the Senior Notes.
The Senior Notes have been guaranteed by the Company (the Parent Guarantor) and certain of its subsidiaries that guarantee the ABL Facility. The guarantees of each of the guarantors of the Senior Notes: (i) rank senior in right of payment to all of such guarantor’s existing and future debt that is subordinated in right of payment to such guarantee; (ii) rank equally in right of payment with all of such guarantor’s existing and future debt that is not subordinated in right of payment to such guarantee; and (iii) rank effectively subordinated to all such guarantor’s existing and future secured debt, including the ABL Facility, to the extent of the value of the collateral securing such debt.
75
Table of Contents
Redemption. The Notes Issuer may, on one or more occasions, redeem all or a portion of the relevant Senior Notes prior to the applicable maturity date at the redemption price set forth in the table below.
| Senior Notes |
Redemption | |||||
| 2026 Senior Notes |
At any time prior to May 12, 2026, at a redemption price equal to the greater of (i) 100% of the principal amount being redeemed and (ii) the sum of the present values of the applicable remaining scheduled payments (not including any portion of payments of interest accrued to the date of redemption) discounted to the redemption date on a semi-annual basis, computed using a discount rate equal to the “Treasury Rate,” as defined in the indenture governing the 2026 Senior Notes, at such redemption date plus 20 basis points; in each case, plus accrued and unpaid interest, if any, to the redemption date.
At any time on or after May 12, 2026 and prior to the maturity date, at a redemption price equal to 100% of the principal amount being redeemed, plus accrued and unpaid interest, if any, to, but not including, the redemption date. | |||||
| 2027 Senior Notes |
At any time prior to the maturity date, at a price equal to 100% of the principal amount being redeemed, plus accrued and unpaid interest, if any, to, but not including, the redemption date.* | |||||
| 2028 Senior Notes |
At any time prior to the maturity date, at the following redemption price, plus accrued and unpaid interest, if any, to, but not including, the redemption date (if redeemed during the twelve-month period commencing on May 1 of the years set out below)*: | |||||
| Year | Redemption price | |||||
| 2025 |
100.667% | |||||
| 2026 and thereafter |
100.000% | |||||
| 2029 Senior Notes |
At any time prior to the maturity date, at the following redemption price, plus accrued and unpaid interest, if any, to, but not including, the redemption date (if redeemed during the twelve-month period commencing on November 1 of the years set out below)*: | |||||
| Year | Redemption price | |||||
| 2025 |
101.417% | |||||
| 2026 |
100.708% | |||||
| 2027 and thereafter |
100.000% | |||||
| 2031 Senior Notes |
At any time prior to May 12, 2031, at a redemption price equal to the greater of (i) 100% of the principal amount being redeemed and (ii) the sum of the present values of the applicable remaining scheduled payments (not including any portion of payments of interest accrued to the date of redemption) discounted to the redemption date on a semi-annual basis, computed using a discount rate equal to the “Treasury Rate,” as defined in the indenture governing the 2031 Senior Notes, at such redemption date plus 20 basis points; in each case, plus accrued and unpaid interest, if any, to, but not including, the redemption date.
At any time on or after May 12, 2031 and prior to the maturity date, at a redemption price equal to 100% of the principal amount being redeemed, plus accrued and unpaid interest, if any, to, but not including, the redemption date. | |||||
| 2032 Senior Notes |
At any time on prior to May 11, 2032, at a price equal to the greater of (i) 100% of the principal amount being redeemed and (ii) the sum of the present values of the applicable remaining scheduled payments (not including any portion of payments of interest accrued to the date of redemption) discounted to the redemption date on a semi-annual basis, computed using a discount rate equal to the “Treasury Rate,” as defined in the indenture governing the 2032 Senior Notes, at such redemption date plus 45 basis points; in each case, plus accrued and unpaid interest, if any, to, but not including, the redemption date.
At any time on or after May 11, 2032 and prior to the maturity date, at a redemption price equal to 100% of the principal amount being redeemed, plus accrued and unpaid interest, if any, to, but not including, the redemption date. | |||||
76
Table of Contents
| Senior Notes |
Redemption | |||||
| 2033(I) Senior Notes |
At any time prior to February 28, 2033, at a price equal to the greater of (i) 100% of the principal amount being redeemed and (ii) the sum of the present values of the applicable remaining scheduled payments (not including any portion of payments of interest accrued to the date of redemption) discounted to the redemption date on a semi-annual basis, computed using a discount rate equal to the “Treasury Rate,” as defined in the indenture governing the 2033(I) Senior Notes, at such redemption date plus 35 basis points; in each case, plus accrued and unpaid interest, if any, to, but not including, the redemption date.
At any time on or after February 28, 2033 and prior to the maturity date, at a redemption price equal to 100% of the principal amount being redeemed, plus accrued and unpaid interest, if any, to, but not including, the redemption date. | |||||
| 2033(II) Senior Notes |
At any time prior to July 15, 2033, at a redemption price equal to the greater of (i) 100% of the principal amount being redeemed and (ii) the sum of the present values of the applicable remaining scheduled payments (not including any portion of payments of interest accrued to the date of redemption) discounted to the redemption date on a semi-annual basis, computed using a discount rate equal to the “Treasury Rate,” as defined in the indenture governing the 2033(II) Senior Notes, at such redemption date plus 35 basis points; in each case, plus accrued and unpaid interest, if any, to, but not including, the redemption date.
At any time on or after July 15, 2033 and prior to the maturity date, at a redemption price equal to 100% of the principal amount being redeemed, plus accrued and unpaid interest, if any, to, but not including, the redemption date. | |||||
| 2034 Senior Notes |
At any time prior to January 15, 2034, at a redemption price equal to the greater of (i) 100% of the principal amount being redeemed and (ii) the sum of the present values of the applicable remaining scheduled payments (not including any portion of payments of interest accrued to the date of redemption) discounted to the redemption date on a semi-annual basis, computed using a discount rate equal to the “Treasury Rate,” as defined in the indenture governing the 2034 Senior Notes, at such redemption date plus 30 basis points; in each case, plus accrued and unpaid interest, if any, to, but not including, the redemption date.
At any time on or after January 15, 2034 and prior to the maturity date, at a redemption price equal to 100% of the principal amount being redeemed, plus accrued and unpaid interest, if any, to, but not including, the redemption date. | |||||
| * | Redemption prices relating to historical call dates or call periods have been excluded. |
In addition, the Notes Issuer may redeem all, but not less than all, of the relevant Senior Notes at a redemption price of 100% of the principal amount outstanding, plus (i) accrued and unpaid interest, if any, to, but not including, the redemption date, (ii) premium, if any, and (iii) all other additional amounts, if any, then due and that will become due on the date of redemption as a result of the redemption or otherwise, if the Notes Issuer determines in good faith that it or any guarantor of the relevant Senior Notes is, or on the next date on which any amount would be payable in respect of the relevant Senior Notes would be, obligated to pay certain additional amounts as a result of certain changes in specified tax laws or certain other circumstances.
Covenants. The indentures governing the Senior Notes contain covenants for the benefit of the holders of the Senior Notes that include, subject to important exceptions, restrictions on the ability of the Parent Guarantor, the Notes Issuer and the Parent Guarantor’s other subsidiaries to: (i) create liens on assets to secure debt; (ii) enter into sale and leaseback transactions; (iii) in the case of a subsidiary that is not the Notes Issuer or a subsidiary guarantor, guarantee our debt; and (iv) sell all or substantially all of its properties and assets or merge or consolidate with or into another company.
Change of Control. The indentures governing the Senior Notes also provide that the Notes Issuer or the Parent Guarantor will be required to make an offer to purchase the Senior Notes at a purchase price equal to 101% of their aggregate principal amount (plus accrued and unpaid interest, if any, to, but not including, the date
77
Table of Contents
of purchase) upon the occurrence of, with respect to the 2027 Senior Notes, the 2028 Senior Notes and the 2029 Senior Notes, a “Change of Control,” as defined in the indenture governing the applicable Senior Notes and, with respect to all other Senior Notes, a “Change of Control Triggering Event,” as defined in the indenture governing the applicable Senior Notes.
Events of Default. The indentures governing the Senior Notes specify a number of events of default, including, among others, a failure to make timely principal or interest payments or to perform the covenants contained in the indentures governing the Senior Notes. If an event of default occurs and is continuing, the trustee under the indenture governing the Senior Notes or the holders of a specified principal amount of the outstanding Senior Notes may declare the principal amount of, premium, if any, and any additional amounts and accrued but unpaid interest on all of the Senior Notes to be due and payable. An acceleration of the Senior Notes may, under specified circumstances, be rescinded by the holders of a majority of the aggregate principal amount of the then outstanding Senior Notes.
Withholding. The Notes Issuer will make all payments with respect to the Senior Notes and the guarantors will make all payments with respect to the guarantees of the Senior Notes free and clear of and without withholding or deduction for or on account of certain taxes, subject to certain exceptions as provided in the indentures governing the Senior Notes. In the event that any such withholding or deduction is made, the Notes Issuer or the guarantors, as the case may be, will, except in certain limited circumstances, be required to pay additional amounts to cover the amounts so withheld or deducted.
Contractual and Other Obligations
Long-Term Debt
See “—Borrowings” above. As of April 30, 2025, our long-term debt liabilities were $7,500 million, comprised of $6,154 million in outstanding Senior Notes and $1,346 million outstanding under our ABL Facility.
Lease Obligations
We lease a significant portion of our branch locations, as well as other premises used for purposes such as district and regional offices and support office centers. Our material lease contracts are generally for real estate or vehicles. We lease real estate and equipment under operating leases. Our finance lease obligations consist of vehicles and building leases.
As of April 30, 2025, our lease liabilities recognized on the balance sheet amounted to $2,876 million, of which $2,700 million was attributable to operating leases and $176 million related to finance leases.
Retirement Benefit Plan Obligations
We sponsor three defined contribution plans, comprising a U.K. stakeholder scheme, a U.S. 401(K) retirement plan, and a U.S. 409A non-qualified deferred compensation plan. In the fiscal year ended April 30, 2025, our pension costs attributable to our defined contribution plan amounted to $48 million.
We also have one defined benefit plan, which closed to new members in 2001 and closed to future benefit accrual in October 2020. The plan is a funded defined benefit plan with trustee-administered assets held separately from those of the Company. During the fiscal year ended April 30, 2024, the corporate trustee was appointed as sole trustee to the plan, and in March 2024, the trustees completed a buy-in transaction with the purchase of a bulk annuity policy covering the entire plan membership. As such, we now hold an insurance policy that is designed to provide cash flows that exactly match the value and timing of the benefits payable to the members it covers. Consequently, we are no longer exposed to investment, interest rate, inflation or life expectancy risk, or future funding requirements associated with this plan.
78
Table of Contents
We reflect the funded status of our defined benefit plan and other post-retirement benefit plans as an asset or liability. This amount is defined as the difference between the fair value of plan assets and the benefit obligation. As of April 30, 2025, our benefit obligations under the defined benefit plan amounted to $83 million and the fair value of our plan assets amounted to $82 million, resulting in a funded status of -$1 million.
Contingent Consideration
As of April 30, 2025, we had contingent liabilities of $18 million relating to acquisitions where contingent consideration may become payable depending on the post-acquisition performance of the acquired businesses.
Capital Expenditures
Our capital expenditures primarily relate to purchases of rental equipment (accounting for 84% of total capital expenditures in the six months ended October 31, 2025 and 81% of total capital expenditures in the fiscal year ended April 30, 2025), with the balance relating to our delivery vehicle fleet, property improvements and IT equipment. The table below presents a breakdown of our capital expenditure by reportable business segment for the periods indicated.
| ($ in millions) | Six months ended October 31, | Fiscal year ended April 30, | ||||||||||||||||||
| 2025 | 2024 | 2025 | 2024 | 2023 | ||||||||||||||||
| North America – General Tool |
651 | 951 | 1,394 | 2,490 | 2,250 | |||||||||||||||
| North America – Specialty |
335 | 321 | 428 | 930 | 819 | |||||||||||||||
| United Kingdom |
84 | 102 | 138 | 219 | 193 | |||||||||||||||
|
|
|
|
|
|
|
|
|
|
|
|||||||||||
| Total rental equipment |
1,070 | 1,374 | 1,960 | 3,639 | 3,262 | |||||||||||||||
| Delivery vehicles, property improvements & IT equipment |
200 | 306 | 458 | 680 | 510 | |||||||||||||||
|
|
|
|
|
|
|
|
|
|
|
|||||||||||
| Total additions |
1,270 | 1,680 | 2,418 | 4,319 | 3,772 | |||||||||||||||
Capital expenditures decreased by $410 million, or 24.4%, to $1,270 million in the six months ended October 31, 2025 from $1,680 million in the six months ended October 31, 2024, primarily due to a reduction in fleet investment during the six months ended October 31, 2025 in line with moderating end-market demand.
Capital expenditures decreased by $1,901 million, or 44.0%, to $2,418 million in the fiscal year ended April 30, 2025 from $4,319 million in the fiscal year ended April 30, 2024, primarily to maintain the appropriate supply of rental assets for our customers and manage the average fleet age of our equipment.
Capital expenditures increased by $547 million, or 14.5%, to $4,319 million in the fiscal year ended April 30, 2024 from $3,772 million in the fiscal year ended April 30, 2023, primarily due to investments made across many categories of fleet to continue to meet the end market demands of our customers.
As of April 30, 2025, we had commitments for capital expenditure of $500 million relating to purchases of rental and other equipment. The amount of our future capital expenditures will depend on a number of factors, including general economic conditions and growth prospects. Due to the nature of our business, our cash flows are countercyclical. This means that in times of improving markets, we invest more in our rental fleet (both to replace existing fleet and to grow the overall fleet size), typically resulting in improved earnings but lower cash flow generation from operations in times of rapid growth. On the contrary, in more benign or declining markets, we invest less in our rental fleet and, as a result, typically generate stronger cash flow from operations as the cycle matures and the growth slows.
Off-Balance Sheet Arrangements
We had no material off-balance sheet arrangements as of October 31, 2025.
79
Table of Contents
Critical Accounting Policies and Estimates
We prepare our consolidated financial statements in accordance with GAAP. The preparation of the consolidated financial statements in conformity with GAAP requires management to make judgements, estimates and assumptions that affect the reported amounts in our consolidated financial statements. Our significant accounting policies are disclosed in Note 2 to our consolidated financial statements included elsewhere in this Registration Statement.
The following critical accounting policies are important to the portrayal of our financial condition, as well as our results of operations, and require some of management’s most subjective and complex judgments. The accounting for some of these matters involves the making of estimates based on current facts, circumstances and assumptions that, in management’s judgment, could change in a manner that would materially affect management’s future estimates with respect to such matters and, accordingly, could cause the Company’s future reported financial condition and results of operations to differ materially from those that it is currently reporting based on management’s current estimates.
Allowance for Credit Losses
We state accounts receivable net of allowances. The allowances for credit losses reflect the Company’s estimate of the amount of receivables that it will be unable to collect based on historical write-off experience reflecting the level of uncollected receivables over the last year within each business, adjusted for factors that are specific to the receivables, the industry in which the Company operates and the economic environment. Adjustments to the loss allowances are recognized in the income statement. Accounts receivables are written off when recoverability is assessed as being remote while subsequent recoveries of amounts previously written off are credited to the income statement.
Useful Lives, Salvage Values and Impairment of Rental Equipment
Rental equipment and property and equipment are recorded at cost and depreciated over their estimated useful lives using the straight-line method. Most types of rental equipment are depreciated to a salvage value of 10% to 15% of cost, although the range of salvage values used varies between 0% to 35%. Rental equipment is depreciated regardless of whether it is out on rent.
The useful life of an asset is determined based on our estimate of the period over which the asset will generate revenues, and the salvage value is determined based on our estimate of the minimum value we will realize from the asset after such period. We review such periods periodically for reasonableness, and may be required to change these estimates based on changes in our industry or other changing circumstances. If these estimates change in the future, we may be required to recognize increased or decreased depreciation expense for these assets.
Based on the circumstances prevailing on April 30, 2025, we estimate that a one year increase or decrease in the useful lives of all of our rental equipment would cause our annual expenses related to depreciation of rental equipment to decrease or increase by $194 million and $240 million, respectively, and that a one year increase or decrease in the useful lives of all of our property and equipment would cause our annual non-rental depreciation and amortization expenses to decrease or increase by $41 million and $54 million, respectively. Based on the circumstances prevailing on October 31, 2025, we estimate that a one year increase or decrease in the useful lives of all of our rental equipment would cause our annual expenses related to depreciation of rental equipment to decrease or increase by $200 million and $248 million, respectively, and that a one year increase or decrease in the useful lives of all of our property and equipment would cause our annual non-rental depreciation and amortization expenses to decrease or increase by $42 million and $57 million, respectively. Similarly, if the estimated salvage value of all of our rental equipment were to increase or decrease by one percentage point, based on the circumstances prevailing on April 30, 2025, we estimate that our annual expenses related to
80
Table of Contents
depreciation of rental equipment would change by $20 million and, based on the circumstances prevailing on October 31, 2025, we estimate that our annual expenses related to depreciation of rental equipment would change by $20 million. If the expenses related to depreciation of rental equipment or to non-rental depreciation and amortization were to increase or decrease as a result of a hypothetical change in either useful lives or, in the case of rental equipment, salvage values, in both cases this would typically result in a proportional increase or decrease in the gross profit we would recognize upon the ultimate disposal of the asset.
Furthermore, at each reporting date, management further assesses whether there are events or changes in circumstances that indicate that the rental equipment’s carrying amount may not be recoverable. Management judgment is necessary in identifying impairment indicators, including the period over which assets have not been rented, the period any assets have been down for repair, the current market conditions and the level of return on investment generated from the assets.
Business Combinations
We have made multiple acquisitions in the past and during the periods presented in this Registration Statement and may continue to make acquisitions in the future. The assets acquired and liabilities assumed are recorded based on their respective fair values at the date of acquisition. The consideration transferred in a business combination is the fair value at the acquisition date of the assets transferred and the liabilities assumed by the Company and includes the fair value of any contingent consideration arrangement. The estimated range of undiscounted payment in respect of the contingent consideration was zero to $35 million and zero to $29 million as of October 31, 2025 and 2024, respectively, and zero to $23 million, zero to $37 million and zero to $48 million as of April 30, 2025, 2024 and 2023, respectively. Long-lived assets (principally rental equipment), goodwill and other intangible assets generally represent the largest components of the acquisition assets acquired. Rental equipment is valued utilizing either a cost or market approach, depending on the asset being valued and the availability of market data. Goodwill is calculated as the excess of the cost of the acquired business over the net of the fair value of the assets acquired and the liabilities assumed. The intangible assets that the Company has acquired are primarily customer relationships and non-compete agreements, which are valued based on an excess earnings or income approach based on projected cash flows and may be amortized over the useful life if they are determined to be finite-lived intangible assets.
Determining the fair value of the assets and liabilities acquired can be judgmental in nature and can involve the use of significant estimates and assumptions. The estimates and assumptions used in valuing acquired assets include, but are not limited to, the amount and timing of projected future cash flows, discount rates used to determine the present value of these cash flows and the useful lives of the assets. Although the Company’s fair value estimates are based upon assumptions believed to be reasonable, these estimates and assumptions are inherently uncertain and subject to refinement. As a result, during the measurement period of one year from the acquisition date, the Company may record adjustments to the assets acquired and liabilities assumed with the corresponding offset to goodwill. Upon conclusion of the measurement period or final determination of fair values of the purchase price of an acquisition, whichever comes first, any subsequent adjustments are recorded in earnings on the income statement.
As part of an acquisition, the Company will also acquire other assets and assume liabilities. These other assets and liabilities typically include, but are not limited to, inventory, accounts receivable, accounts payable and other working capital items. Due to their short-term nature, the fair values of these other assets and liabilities generally approximate the book values on the acquired entities’ balance sheets. Acquisition-related expenses are recognized separately from the business combination and expensed as selling, general and administrative expenses in the income statement as incurred.
81
Table of Contents
Evaluation of Goodwill Impairment
We test the recoverability of goodwill on an annual basis and at interim periods when events or circumstances indicate that an impairment loss may have been incurred. The annual analysis is conducted in the fourth quarter each year.
When conducting the goodwill impairment test, we compare the fair value of our reporting units with the carrying value. The goodwill impairment test is conducted at the reporting unit level, which is the same as, or one level below, an operating segment for which discrete financial information is available and regularly reviewed by segment management. If the carrying value of the reporting unit is greater than its fair value, the Company recognizes an impairment charge for the amount equal to that excess, limited to the total amount of goodwill allocated to the reporting unit.
Prior to conducting an impairment test, we may first assess qualitative factors to determine whether it is more-likely-than-not that the fair value of a reporting unit is less than its carrying amount as a basis for determining whether it is necessary to perform the quantitative goodwill impairment test. If a quantitative impairment test is performed, the fair value of the reporting unit is estimated using a combination of an income approach on the present value of estimated future cash flows and a market approach based on published earnings multiples of comparable entities with similar operations and economic characteristics as well as acquisition multiples paid in recent transactions. As part of our income approach, we make several assumptions and estimates.
The following assumptions are significant to our income approach:
| • | Business projections: We make assumptions about levels of rental market activity, inflation and costs. These assumptions drive our budget and forecasting assumptions for pricing, rental demand and costs within our business, and feed into our budgeting and forecasting processes, which result in projected income statements, balance sheets and cash flow projections over a three-year horizon. |
| • | Long-term growth rate and terminal value: Beyond the initial three-year period of business projections, we utilize an assumed long-term growth rate for a further seven years, representing the expected rate at which a reporting unit’s cash flow is projected to grow. At the end of the ten-year period projected by the business projections and application of long-term growth rate, we calculate a terminal value based on relevant market multiples. |
| • | Discount rates: Each reporting unit’s estimated future cash flows are discounted at a rate that is consistent with a weighted-average cost of capital that is likely to be expected by a market participant. |
As part of our market approach, we estimate fair value based on multiples paid in recent acquisitions of companies by ourselves and peer-group companies.
In connection with our goodwill impairment tests that were conducted during the fiscal years ended April 30, 2025, 2024 and 2023, we bypassed the optional qualitative assessment for each reporting unit and quantitatively compared the fair values of our reporting units with their carrying values.
While we believe that our discounted cash flows are based upon reasonable and appropriate assumptions, which are weighted for their likely probability of occurrence, about our underlying business activities, many of the factors used in assessing the fair value are outside of the control of management. Accordingly, the underlying assumptions and estimates may change in the future, which could materially affect the estimate of the fair value of a reporting unit and, thus, the likelihood and amount of potential impairment.
There were no indicators of goodwill impairment during the six months ended October 31, 2024 or during the fiscal years ended April 30, 2025, 2024 or 2023. An impairment indicator was identified in the UK reporting
82
Table of Contents
unit during the six months ended October 31, 2025 as a result of the operational restructure of the United Kingdom segment. Based on this, a quantitative goodwill impairment test was performed by the Company on the UK reporting unit. No impairment was recognized as a result of this test.
Income Taxes
We account for income taxes under the asset and liability method. Under this method, deferred tax assets and liabilities are recognized based upon the estimated future tax consequences attributable to differences between the financial statement carrying amount of existing assets and liabilities and their respective tax basis, as well as operating loss and tax credit carryforwards. Deferred tax assets and liabilities are measured using enacted tax rates expected to apply to taxable income in the years in which those temporary differences are expected to be recovered or settled. The effect on deferred tax assets and liabilities of a change in tax rates is recognized in income tax expense (benefit) in the period the tax rates are enacted.
The Company’s deferred tax assets are reduced by a valuation allowance if, based on the weight of available evidence, it is more likely than not (a likelihood of more than 50%) that some portion or all of the deferred tax assets will not be realized. We evaluate the realizability of deferred tax assets for each of the jurisdictions in which we operate by assessing all positive and negative evidence. This includes historical operating results, known or planned operating developments, the period of time over which certain temporary differences will reverse, consideration of the reversal of certain deferred tax liabilities, tax law carryback capability in the particular country, and prudent and feasible tax planning strategies. After evaluation of these factors, if the deferred tax assets are expected to be realized within the tax carryforward period allowed for that specific jurisdiction, we would conclude that no valuation allowance would be required. To the extent that the deferred tax assets exceed the amount that is expected to be realized within the tax carryforward period for a particular jurisdiction, the Company establishes a valuation allowance.
We have historically considered the undistributed earnings of foreign subsidiaries to be indefinitely reinvested, and accordingly, no taxes have been provided on such earnings. We regularly review our cash position and determination of indefinite reinvestment of foreign earnings. If it is determined that all or a portion of such foreign earnings would be repatriated, we may be subject to additional foreign withholding taxes and U.S. state income taxes.
We are subject to ongoing tax examinations and assessments in various jurisdictions, and accruals for tax contingencies are established based on the probable outcomes of such examinations. We recognize benefits from tax positions only if it is more likely than not that the tax position will be sustained on examination by the taxing authorities, based on the technical merits of the positions. The tax benefits recognized in the combined financial statements from such positions are measured as the largest amount of tax benefit that is greater than 50% likely of being realized upon settlement. Judgment is required in evaluating tax positions and determining unrecognized tax benefits, which could increase or decrease our effective tax rate as well as impact our operating results. We regularly re-evaluate the technical merits of our tax positions and may recognize the benefit of a tax position in certain circumstances, including when: (1) a tax examination is completed; (2) applicable tax laws change, including through a tax case ruling or legislative guidance; or (3) the applicable statute of limitations expires.
Changes in Accounting Standards and Policies
In November 2023, the Financial Accounting Standards Board (FASB) issued Accounting Standards Update No. 2023-07, “Segment Reporting (Topic 280): Improvements to Reportable Segment Disclosures” (ASU 2023-07), which is intended to improve reportable segment disclosure requirements, primarily through enhanced disclosures about significant segment expenses. We have adopted ASU No. 2023-07 using the full retrospective method, which requires us to retroactively revise each prior period presented. The financial statements presented in this Registration Statement reflect the revised standard.
83
Table of Contents
In December 2023, the FASB issued Accounting Standards Update No. 2023-09, “Income Taxes (Topic 740): Improvements to Income Tax Disclosures” (ASU 2023-09), which modifies the rules on income tax disclosures. We have early adopted ASU No. 2023-09. The financial statements presented in this Registration Statement reflect the restated amounts.
For a more detailed description of recently adopted accounting standards and policies, as well as accounting pronouncements not yet adopted, please see Note 2 to our condensed consolidated financial statements and Note 2 to our consolidated financial statements included elsewhere in this Registration Statement.
Quantitative and Qualitative Disclosures about Market Risk
We are exposed to a variety of market risks, primarily related to changes in interest rates and foreign currencies.
Interest Rate Risk
As of October 31, 2025, we had $7,680 million of outstanding debt, of which 80% bears interest at a fixed rate and 20% bears interest at a floating rate. Since our accounting policy requires all borrowings to be held at amortized cost, the carrying value of fixed rate debt is unaffected by changes in credit conditions in the debt markets and, accordingly, there is no exposure to fair value interest rate risk. We are, however, exposed to interest rate risk on our floating rate debt under the ABL Facility, and fluctuations in interest rates may affect our interest expense under the ABL Facility and any new debt arrangement.
Our ABL Facility is priced based on average availability according to a grid, varying from the applicable benchmark interest rate (SOFR for U.S. dollar, SONIA for British pound and CORRA for Canadian dollar loans) plus 125 basis points to 137.5 basis points. As of October 31, 2025, the interest rates applicable to the floating rate debt were the applicable benchmark interest rate plus 125 basis points. As of the same date, based on the amount of floating rate debt outstanding, the Company’s pre-tax profits would change by approximately $15 million for each percentage point change in interest rates applicable to the floating rate debt and, after tax effects, equity would change by approximately $11 million. The amount of our floating rate debt may fluctuate as a result of changes in the amount of debt outstanding under the ABL Facility.
We periodically utilize interest rate swap agreements to manage and mitigate our exposure to changes in interest rates. However, as of October 31, 2025, we had no such swap agreements outstanding. We may also at times hold cash and cash equivalents which earn interest at a variable rate.
Currency Risk
Although our reporting currency is the U.S. dollar, we derived 15.1% and 14.7% of our revenue for the six months ended October 31, 2025 and for the fiscal year ended April 30, 2025, respectively, from companies that have non-U.S. dollar currencies, primarily British pounds and Canadian dollars from our U.K. and Canadian businesses, respectively. Consequently, any change in exchange rates between the U.S. dollar and British pound or the Canadian dollar will affect our consolidated income statement and balance sheet when our results are translated into U.S. dollars for reporting purposes.
Our exposure to exchange rate movements on trading transactions is relatively limited. All Group companies invoice revenue in their respective local currency and generally incur expense and purchase assets in their local currency. Consequently, we do not routinely hedge either forecast foreign exchange exposures or the impact of exchange rate movements on the translation of overseas profits into U.S. dollars.
Based on the currency mix of our profits and debt levels, interest and exchange rates as of October 31, 2025, a 1% change in the Canadian dollar and British pound to U.S. dollar exchange rates would impact pre-tax profits on an annualized basis by $0.6 million and equity by $21.6 million. As of October 31, 2025, we had no outstanding foreign exchange contracts.
84
Table of Contents
Refer to “Properties” under Item 1 (Business) of this Registration Statement for a discussion of our properties.
Item 4. Security Ownership of Certain Beneficial Owners and Management.
The following table shows the number of Ashtead Shares beneficially owned as of January 20, 2026, by those known to us to beneficially own more than 5% of Ashtead Shares, by our directors and named executive officers (as defined in Item 6 (Executive Compensation)) individually and by our directors and all of our executive officers as a group.
For purposes of this table, unless otherwise indicated, beneficial ownership has been determined in accordance with the provisions of Rule 13d-3 under the Exchange Act, pursuant to which, in general, a person is deemed to be the beneficial owner of a security if they have or share the power to vote or to direct the voting of the security or the power to dispose or to direct the disposition of the security, or if they have the right to acquire the beneficial ownership of the security within 60 days. Any fractional shares are rounded to the nearest whole share. The percentage of shares outstanding provided in the tables are based on 416,096,962 Ashtead Shares (excluding treasury shares) outstanding as of January 20, 2026. The address of each of our directors and executive officers listed below is c/o Sunbelt Rentals Holdings, Inc., 1799 Innovation Pt, Fort Mill, South Carolina 29715.
| Name and Address of Beneficial Owner |
Amount and Nature of Beneficial Ownership(1) |
Percent of Class |
||||||
| Principal shareholders: |
||||||||
| Dodge & Cox(2) |
48,227,400 | (5) | 11.6 | % | ||||
| BlackRock, Inc.(3) |
34,037,363 | (6) | 8.2 | % | ||||
| The Vanguard Group, Inc.(4) |
22,251,496 | (7) | 5.2 | % | ||||
| Executive officers and directors: |
||||||||
| Brendan Horgan |
419,000 | * | ||||||
| Alex Pease |
0 | * | ||||||
| Brad Lull |
45,000 | * | ||||||
| John Washburn |
32,567 | * | ||||||
| Rod Samples |
15,469 | * | ||||||
| Michael Pratt |
359,195 | * | ||||||
| Paul Walker |
14,000 | * | ||||||
| Nando Cesarone |
0 | * | ||||||
| Angus Cockburn |
1,000 | * | ||||||
| Jill Easterbrook |
0 | * | ||||||
| Renata Ribeiro |
600 | * | ||||||
| James Singleton |
0 | * | ||||||
| Roy Twite |
1,550 | * | ||||||
| All current executive officers and directors as a group (14 persons) |
587,873 | * | ||||||
| * | Represents less than 1%. |
| (1) | Unless otherwise indicated, each person or group of persons named above has sole investment and voting power with respect to the shares indicated. For purposes of this table, a person or group of persons is deemed to have “beneficial ownership” of any shares, which, as of a given date, such person or group has the right to acquire within 60 days after such date. For purposes of computing the percentage of outstanding shares held by each person or group of persons named above on a given date, any security, which such person or group has the right to acquire within 60 days after such date, is deemed to be outstanding for the purpose of computing the percentage ownership of such person or group, but is not deemed to be outstanding for the purpose of computing the percentage ownership of any other person or group. |
| (2) | The address of Dodge & Cox is 555 California Street, 40th Floor, San Francisco, CA 94104. |
| (3) | The address of Blackrock, Inc. is 50 Hudson Yards, New York, NY 10001. |
| (4) | The address of The Vanguard Group, Inc. is 100 Vanguard Blvd, Malvern, PA 19355. |
| (5) | Dodge & Cox reported having sole voting power over 47,333,500 shares and sole investment power over 48,227,400 shares. |
85
Table of Contents
| (6) | The beneficial ownership reported in the table above for BlackRock, Inc. is an estimate based on the most recent share register analysis available to Ashtead with respect to Ashtead Shares as of December 19, 2025. Because the information in the table above does not reflect any transactions between December 19, 2025 and January 20, 2026, the actual beneficial ownership of Ashtead Shares by BlackRock, Inc. on January 20, 2026 may be different than reported in the table above. |
| (7) | The beneficial ownership reported in the table above for The Vanguard Group, Inc. is reported as of December 31, 2025. Because the information in the table above does not reflect any transactions between December 31, 2025 and January 20, 2026, the actual beneficial ownership of Ashtead Shares by The Vanguard Group, Inc. on January 20, 2026 may be different than reported in the table above. |
Item 5. Directors and Executive Officers.
The following table sets forth our executive officers and directors as of the date of this Registration Statement. Except as described in “Transactions with Related Parties” under Item 7 (Certain Relationships and Related Transactions, and Director Independence), there is no family relationship between or among our executive officers and directors. Directors are elected or appointed to hold office until the next annual meeting of stockholders or until such director’s successor is elected and qualified or such director’s earlier death, retirement or removal. Officers are appointed by our Board of Directors and hold office until death, resignation or removal by the Sunbelt Rentals Board, subject to the terms of any employment agreements.
| Name |
Age | Position | ||
| Brendan Horgan |
52 | Chief Executive Officer and Director | ||
| Alex Pease |
54 | Chief Financial Officer | ||
| John Washburn |
55 | Chief Operating Officer | ||
| Barbara Clark |
45 | Senior Vice President and Chief Accounting Officer | ||
|
Lynne Fuller-Andrews |
58 | Executive Vice President, General Counsel and Company Secretary | ||
| Kyle Horgan |
50 | Executive Vice President, Specialty | ||
| Brad Lull |
51 | Executive Vice President, Strategy and Business Development | ||
| Paul Walker |
68 | Chair of the Sunbelt Rentals Board | ||
| Nando Cesarone |
54 | Director | ||
| Angus Cockburn |
62 | Director | ||
| Jill Easterbrook |
54 | Director | ||
| Renata Ribeiro |
54 | Director | ||
| James Singleton |
69 | Director | ||
| Roy Twite |
58 | Director |
Biographical information concerning our executive officers and directors is as follows:
Brendan Horgan, Chief Executive Officer, was appointed as Chief Executive of Ashtead in May 2019 and will serve as Chief Executive Officer of Sunbelt Rentals beginning on the Scheme Effective Date. Mr. Horgan joined the board of Ashtead in January 2011 and the board of Sunbelt Rentals in February 2025. During his nearly 30-year career with Sunbelt Rentals, Inc. and Ashtead, he has held positions of increasing responsibility, including as Chief Operating Officer of North America from 2003 until becoming Chief Executive Officer of North America in 2011, a position he held until being appointed as Chief Executive of Ashtead. Mr. Horgan received a B.S. from Radford University. Mr. Horgan was selected to serve as Chief Executive Officer and on the Sunbelt Rentals Board because of his more than 25 years of experience in the equipment rental business, detailed knowledge of operations and active leadership of our strategy, M&A, commercial go-to-market and business development.
Alex Pease, Chief Financial Officer, was appointed as Chief Financial Officer of Ashtead in March 2025 and will serve as Chief Financial Officer of Sunbelt Rentals beginning on the Scheme Effective Date. Prior to his current position, Mr. Pease joined Ashtead as Chief Financial Officer Designate in October 2024. Previously, Mr. Pease served as Chief Financial Officer of WestRock Company from November 2021 until its merger with Smurfit Kappa Group plc in July 2024. Before that, Mr. Pease served as Chief Financial Officer for CommScope from April 2018 to November 2021, as Chief Financial Officer for Snyder’s-Lance from November 2016 to April 2018 and as Chief Financial Officer of EnPro Industries from February 2011 to September 2015. Prior to transitioning to financial leadership roles, Mr. Pease spent more than 10 years with McKinsey & Company in a
86
Table of Contents
wide range of advisory roles, leaving as a partner in 2011. Mr. Pease graduated from the U.S. Naval Academy in 1994 and served as a U.S. Navy SEAL from 1994 to 2000. Mr. Pease also earned an M.B.A. from the Tuck School of Business at Dartmouth.
John Washburn, Chief Operating Officer, was appointed as Chief Operating Officer of Sunbelt Rentals North America in December 2023 and will serve as Chief Operating Officer of Sunbelt Rentals beginning on the Scheme Effective Date. Mr. Washburn is also the segment manager for the North America – General Tool segment. Prior to his current role, Mr. Washburn served as Executive Vice President of Sales and Marketing of Sunbelt Rentals from June 1994 to December 2023. Mr. Washburn received his B.A. in Business Management at Ohio Dominican University.
Barbara Clark, Senior Vice President and Chief Accounting Officer, was appointed as Senior Vice President and Chief Accounting Officer of Ashtead in January 2025 and will serve as Senior Vice President and Chief Accounting Officer of Sunbelt Rentals beginning on the Scheme Effective Date. Prior to her current role, Ms. Clark served as Ashtead’s Director of Group Finance from October 2018 to December 2024 and Director of Financial Reporting from July 2016 to October 2018. Before joining Ashtead, Ms. Clark spent fifteen years at Deloitte, including as Audit Director from June 2012 to June 2016 and Senior Manager from June 2008 to May 2012. Ms. Clark earned her M.A. in Social and Political Science from the University of Cambridge.
Lynne Fuller-Andrews, Executive Vice President, General Counsel and Company Secretary, was appointed as Executive Vice President and General Counsel of Ashtead in May 2024 and will serve as Executive Vice President and General Counsel of Sunbelt Rentals beginning on the Scheme Effective Date. From September 2021 to May 2024, Ms. Fuller-Andrews served as Senior Vice President and General Counsel of Sunbelt Rentals, Inc. Previously, Ms. Fuller-Andrews served as Vice President and Deputy General Counsel of Hanesbrands from January 2013 until August 2021. Before that, Ms. Fuller-Andrews served as Assistant General Counsel and later Associate General Counsel for Hanesbrands and as Corporate Counsel and Employment Counsel for Sara Lee Corporation. Ms. Fuller-Andrews received a B.A. in Economics and Industrial Relations at the University of North Carolina at Chapel Hill and earned a J.D. from the University of North Carolina School of Law.
Kyle Horgan, Executive Vice President, Specialty, was appointed as Executive Vice President, Specialty of Sunbelt Rentals North America in May 2023 and will serve as Executive Vice President, Specialty of Sunbelt Rentals beginning on the Scheme Effective Date. Prior to his current role, Mr. Horgan served as Senior Vice President of Business Development from December 2017 to April 2022, Senior Vice President of Operations from May 2014 to December 2017, Operational Vice President from May 2007 to May 2014, and in various other positions having joined Sunbelt Rentals North America in July 1998. Mr. Horgan received a B.A. in Business Administration and Marketing from James Madison University. Mr. Horgan is the brother of Brendan Horgan, the Chief Executive Officer of Sunbelt Rentals.
Brad Lull, Executive Vice President, Strategy and Business Development, was appointed as Executive Vice President, Strategy and Business Development of Sunbelt Rentals North America in November 2017 and will serve as Executive Vice President, Strategy and Business Development of Sunbelt Rentals beginning on the Scheme Effective Date. Mr. Lull joined Sunbelt Rentals North America as Marketing Director in October 1997. Prior to his current appointment, Mr. Lull was appointed Executive Vice President of Central Operations in December 2017, Vice President of Business Development in September 2012, and District Manager in December 2004. Mr. Lull received his B.S. in Liberal Arts from York College of Pennsylvania.
Paul Walker was appointed as a director of Ashtead in July 2018 and as non-executive Chair in September 2018, and he will continue serving as Chair of the Sunbelt Rentals Board following the Scheme Effective Date. Mr. Walker has served as the non-executive Chair of RELX plc since March 2021. Mr. Walker was previously Chief Executive of the Sage Group plc from May 1994 to September 2010 and served on the boards of Diageo plc from June 2002 to October 2011, Experian plc from June 2010 to July 2019, Halma plc from April 2013 to July 2021, Sophos Group plc from June 2015 to March 2020 and MyTravel Group plc from December 2000 to
87
Table of Contents
December 2004. Mr. Walker received his Economics degree at the University of York. Mr. Walker was selected to serve on the Sunbelt Rentals Board because of his significant experience as a public company executive, strong financial background and high-level non-executive experience.
Nando Cesarone was appointed as a director of Ashtead in August 2025 and will continue serving on the Sunbelt Rentals Board following the Scheme Effective Date. Mr. Cesarone is currently Executive Vice President and President U.S. for United Parcel Service Inc. (NYSE: UPS), where he has held a variety of senior management roles, including airline and engineering responsibilities, since 1990. He has also served as a non-executive director of Airlines for America since June 2022. Mr. Cesarone received his M.B.A. at Heriot-Watt University. Mr. Cesarone was selected to serve on the Sunbelt Rentals Board because of his significant public company executive experience.
Angus Cockburn was appointed as a director of Ashtead in October 2018 and will continue serving on the Sunbelt Rentals Board following the Scheme Effective Date. Mr. Cockburn has served on the board of The Edrington Group Limited since September 2020, including as chair since April 2025, on the board of BAE Systems plc since November 2023, and as chair of the board of James Fisher and Sons plc since May 2021. Previously, Mr. Cockburn was Chief Financial Officer of Serco Group plc from October 2014 to April 2021. Additionally, Mr. Cockburn was Group Finance Director, Chief Financial Officer and Interim Chief Executive at Aggreko plc from May 2000 to September 2014 and served as a non-executive Director at GKN plc from January 2013 to April 2018, at Howden Joinery Group plc from October 2006 to September 2013 and at STS Global Income & Growth Trust plc from May 2021 to June 2024. Mr. Cockburn received his M.B.A. at Switzerland’s IMD Business School. He is also an Honorary Professor at the University of Edinburgh and a member of the Institute of Chartered Accountants of Scotland. Mr. Cockburn was selected to serve on the Sunbelt Rentals Board because of his deep understanding of the rental market and specialty businesses and extensive experience as chief financial officer at several major global organizations.
Jill Easterbrook was appointed as a director of Ashtead in January 2020 and will continue serving on the Sunbelt Rentals Board following the Scheme Effective Date. Ms. Easterbrook has served on the board of Tracsis plc since October 2022, including as non-executive chair since July 2023, and as non-executive chair of Headland Consultancy since July 2021. Ms. Easterbrook has held several prior board positions as well, including at Ultimate Products from September 2020 to October 2024 and at Auto Trader Group plc from July 2015 to September 2024. Ms. Easterbrook served as Chief Executive Officer of JP Boden & Co from February 2017 to January 2020 and held a number of senior management positions with Tesco PLC from 2001 to 2016. Ms. Easterbrook holds a degree in Economics from Leeds University. Ms. Easterbrook was selected to serve on the Sunbelt Rentals Board because of her strong digital expertise within retail environments and her extensive board experience.
Renata Ribeiro was appointed as a director of Ashtead in January 2022 and will continue serving on the Sunbelt Rentals Board following the Scheme Effective Date. Since June 2022, Ms. Ribeiro has served as Senior Vice President, Strategic Operations for Carnival Corporation & plc, where she previously served in numerous senior management roles since October 2008. Prior to that, Ms. Ribeiro held positions at Natura & Co., serving as Director of Commercial Innovation from 2007 to 2008 and as Director of International Business Development from 2005 to 2007. Ms. Ribeiro also worked in strategic management consulting for 10 years with the Boston Consulting Group and Booz, Allen & Hamilton (now Strategy&). She earned her M.B.A. at Wake Forest University School of Business. Ms. Ribeiro was selected to serve on the Sunbelt Rentals Board because of her strong commercial and digital experience and her significant executive leadership experience in large scale publicly, dual-listed global company.
James Singleton was appointed as a director of Ashtead in August 2025 and will continue serving on the Sunbelt Rentals Board following the Scheme Effective Date. Mr. Singleton currently serves as lead independent director and chair of the executive committee of Wesco International Inc. (NYSE: WCC) where he has served as a director since the company’s initial public offering in May 1999. Previously, Mr. Singleton was the Chief
88
Table of Contents
Executive Officer and Chair at Curex Group LLC from October 2009 to October 2023. Mr. Singleton received a B.A. in English and History at Yale University and an M.B.A. from the University of Chicago Booth School of Business. Mr. Singleton was selected to serve on the Sunbelt Rentals Board because of his significant public company executive and director experience.
Roy Twite was appointed as a director of Ashtead in June 2024 and will continue serving on the Sunbelt Rentals Board following the Scheme Effective Date. Mr. Twite has served as Chief Executive Officer of IMI plc since May 2019. Mr. Twite was previously a non-executive director of Halma plc from July 2014 to June 2024. Mr. Twite completed his master’s degree at Cambridge University and the Advanced Management Program (AMP) at Harvard Business School. Mr. Twite was selected to serve on the Sunbelt Rentals Board because of his wide-ranging knowledge of the global industrial sector and extensive strategic, management and operational experience.
Sunbelt Rentals Board and Committee Membership
Our business, property and affairs will be managed under the direction of the Sunbelt Rentals Board. The Sunbelt Rentals Board consists of eight directors, of whom the following are “independent” as defined under applicable NYSE listing standards: Paul Walker, Nando Cesarone, Angus Cockburn, Jill Easterbrook, Renata Ribeiro, James Singleton and Roy Twite. Members of the Sunbelt Rentals Board are kept informed of our business through discussions with our Chief Executive Officer, Chief Financial Officer and other officers, by reviewing materials provided to them, by visiting our offices and facilities, and by participating in meetings of the Sunbelt Rentals Board and its committees. While retaining overall responsibilities, the Sunbelt Rentals Board assigns certain of its responsibilities to permanent committees consisting of board members appointed by it. We currently have the following committees: Audit Committee, Compensation Committee and Nominating and Corporate Governance Committee, each of which has the responsibilities and composition described below.
Audit Committee
The Audit Committee currently consists of Angus Cockburn, Jill Easterbrook and Nando Cesarone. Each member of our Audit Committee is independent under applicable NYSE listing standards and meets the standards for independence required by U.S. securities law requirements applicable to public companies, including Rule 10A-3 of the Exchange Act. Each member is financially literate under applicable NYSE listing standards and the Sunbelt Rentals Board has determined that Angus Cockburn is qualified as an audit committee financial expert within the meaning of applicable SEC regulations.
The Audit Committee oversees and evaluates and, where necessary or advisable, makes recommendations as to the quality and integrity of the financial statements of the Company, the internal control and financial reporting systems of the Company, the compliance by the Company with legal and regulatory requirements in respect of financial disclosure, the qualification, independence and performance of the Company’s independent auditors and the performance of the Company’s internal audit function. In addition, the Audit Committee is directly responsible for the appointment, compensation, retention, termination and oversight of the work of the independent auditor (including oversight of the resolution of any disagreements between management and the independent auditor regarding financial reporting) for the purpose of preparing audit reports or performing other audit, review or attestation services for the Company, subject to any applicable approvals required from the Sunbelt Rentals Board or our stockholders.
Compensation Committee
The Compensation Committee currently consists of James Singleton, Renata Ribeiro and Roy Twite. Each member of our Compensation Committee is independent under applicable NYSE listing standards and qualifies as a “non-employee director” for purposes of Rule 16b-3 under the Exchange Act.
89
Table of Contents
The Compensation Committee reviews and approves (or recommends for the approval of the Sunbelt Rentals Board) compensation of the Company’s directors and executive officers (including the Chief Executive Officer). The Compensation Committee also reviews and, as it deems appropriate, recommends to the Sunbelt Rentals Board policies, practices and procedures relating to succession planning for the executive officers and other managerial employees and the establishment and administration of employee benefit plans and stock ownership guidelines. Furthermore, the Compensation Committee also exercises all authority under the Company’s employee equity incentive plans, subject to any applicable approvals required from our board of directors or our shareholders.
Nominating and Corporate Governance Committee
The Nominating and Corporate Governance Committee currently consists of Paul Walker, Angus Cockburn and James Singleton. Each member of our Nominating and Corporate Governance Committee is independent under applicable NYSE listing standards.
The Nominating and Corporate Governance Committee seeks and recommends to the Sunbelt Rentals Board individuals qualified to serve as directors, considers any nominations of director candidates validly made by stockholders, determines the criteria for selecting new directors, reviews and recommends to the Sunbelt Rentals Board independence determinations, and establishes and administers an assessment of board, committee and individual director performance.
Item 6. Executive Compensation.
This section consists of two parts. The first part, entitled “Historical Compensation,” provides the information required by Item 402 of the SEC’s Regulation S-K with respect to “named executive officers” (as defined in “—Historical Compensation” below) and individuals who served as directors of Ashtead during the fiscal year ended April 30, 2025. The disclosure includes a Compensation Discussion and Analysis and Executive Compensation Tables covering the compensation paid to the named executive officers in respect of their employment with Ashtead and its subsidiaries during the fiscal year ended April 30, 2025, as well as a Director Compensation table covering the compensation paid to the directors in respect of their service with Ashtead during the fiscal year ended April 30, 2025. The second part, entitled “Post-Listing Compensation Arrangements,” describes certain post-listing compensation arrangements that are expected to apply to the named executive officers and directors, which arrangements remain subject to the review and approval by the Compensation Committee.
Historical Compensation
References in this Historical Compensation section to named executive officers refer to the following individuals based on their status as individuals who would have been considered executive officers of Ashtead during Ashtead’s fiscal year ended April 30, 2025. Unless specified herein or otherwise clear from the context, references in this section to 2025 and 2024 refer to Ashtead’s fiscal years ended April 30, 2025 and 2024, respectively.
| Named Executive Officer |
Position with Ashtead during the fiscal year ended 2025 | |
| Brendan Horgan |
Chief Executive Officer | |
| Alex Pease |
Chief Financial Officer (in such role since March 2025) | |
| Michael Pratt |
Former Chief Financial Officer (in such role through February 2025) | |
| John Washburn |
Chief Operations Officer | |
| Rod Samples |
Chief Administration Officer | |
| Brad Lull |
Executive Vice President, Business Development & Strategy | |
90
Table of Contents
Compensation Discussion and Analysis
During the fiscal year ended April 30, 2025, compensation of the named executive officers was overseen by the Ashtead Remuneration Committee. The composition and roles of the Ashtead Remuneration Committee are described further below.
Elements of Compensation
The table below sets forth each material element of the compensation of the named executive officers for the fiscal year ended April 30, 2025.
| Component |
Purpose and Link to Strategy, Long-term Interests and Sustainability |
Operation |
Opportunity |
Performance Metrics | ||||
| Base Salary | Competitive salaries are set to attract, retain and motivate executives to deliver the long-term success of Ashtead’s business strategy, without paying more than is necessary to fill the roles with highly qualified individuals. | Reviewed annually; changes are generally effective on May 1 for executive directors of Ashtead and June 1 for other named executive officers.
Base salary is payable on a monthly or bi-weekly basis. Determined by the Ashtead Remuneration Committee by taking into consideration the individual’s skills, experience, performance and position against peers.
When determining increases, consideration is given to: (i) scope of role and responsibility; (ii) personal performance; (iii) Ashtead performance; (iv) remuneration trends across Ashtead; and (v) competitive market practice. |
While there is no maximum salary level, base salaries are typically positioned around the median level for comparable positions in the relevant market for talent.
Increases will normally be no higher than the typical increases for other employees in the relevant geography.
The Ashtead Remuneration Committee may, in its discretion, award larger increases in certain circumstances, such as a change in scope and/or responsibilities or development in the role. |
Not applicable. | ||||
| Annual Bonuses | Annual bonuses are facilitated through the Ashtead Group plc 2017 Deferred Bonus Plan (the DBP). The purposes of the DBP are to incentivize the executives to achieve clearly defined stretching annual targets, while aligning short-term and long-term rewards through compulsory deferral of a portion of the bonus payout earned into share equivalent units that track the value of an Ashtead Share (referred to as DBP | The DBP runs for consecutive three-year periods with a significant proportion of any earned bonus being compulsorily deferred into DBP awards. Based on achievement of predetermined annual performance targets, participants receive two-thirds of the combined total of their earned bonus payout for the current year and the value of any DBP awards brought forward from the previous year at the then current share price. The other one-third is compulsorily deferred into a new DBP award evaluated at the then current share price. | The maximum bonus opportunity as a percentage of base salary in respect of a fiscal year is 225% for Mr. Horgan, 175% for Messrs. Pease and Pratt and 150% for the other named executive officers. 50% of the maximum bonus pays out for target performance and 30% of the maximum bonus pays out for threshold performance. | Performance measures for annual bonuses are selected by the Ashtead Remuneration Committee to deliver stretching annual financial performance while aligning short-term and long-term rewards.
The Ashtead Remuneration Committee will select stretching financial targets for annual bonuses at the start of each fiscal year. Ashtead operates in a | ||||
91
Table of Contents
| Component |
Purpose and Link to Strategy, Long-term Interests and Sustainability |
Operation |
Opportunity |
Performance Metrics | ||||
| awards). This deferral enhances retention and aligns executives with shareholder interests. |
DBP awards are subject to 50% forfeiture for each subsequent year of the plan period where performance falls below the forfeiture threshold established by the Ashtead Remuneration Committee.
At the expiration of each three-year period, participants will, subject to attainment of the performance conditions established for that year, receive in cash their bonus payout earned for that year plus the value of any outstanding DBP awards brought forward from the prior two years at the then current share price.
DBP awards may include the right to receive the value of the dividends that would have accrued during the vesting period.
The annual bonus payouts are subject to Ashtead’s clawback provisions described under “—Compensation Clawback Provisions” below. |
rapidly changing sector and, therefore, the Ashtead Remuneration Committee may change the weighting of the measures, or use different measures, for subsequent fiscal years, as appropriate.
Payouts are determined by the Ashtead Remuneration Committee after the year-end, taking into account performance against the predetermined targets. The Ashtead Remuneration Committee retains the discretion to review outcomes to ensure they are appropriate in the context of overall performance and how it was delivered.
The Ashtead Remuneration Committee has the discretion to adjust measures, targets or weightings for any exceptional events that may occur during the year. | ||||||
| Restricted Stock Units (RSUs) | RSUs are granted under the Ashtead Group Long-Term Incentive Plan 2021 (LTIP) to attract and retain executives in talent markets where hybrid equity incentive arrangements are common and to incentivize the executives to deliver the long-term success of Ashtead’s business strategy while achieving sustainable long-term shareholder value creation. | Annual RSU awards normally vest, subject to continued employment through the applicable vesting date (and, for Messrs. Horgan and Pease, achievement of one or more performance targets, which we refer to as an underpin), in equal tranches over a period of two, three or four years.
For Mr. Horgan, vested shares (net of taxes) are required to be held for a one-year period following vesting.
RSUs may include the right to receive dividend equivalents on vested shares during the holding period. |
The maximum annual RSU award opportunity as a percentage of base salary in respect of a fiscal year is 150% for Mr. Horgan, 90% for Mr. Pease and 75% for each of the other named executive officers. | For Messrs. Horgan and Pease, RSUs will vest to the extent that the Ashtead Remuneration Committee determines that the underpin has been achieved. The Ashtead Remuneration Committee will disclose, at the time of grant, the factors that will be considered with respect to achievement of the underpin, which may include achieving a minimum acceptable level of return on | ||||
92
Table of Contents
| Component |
Purpose and Link to Strategy, Long-term Interests and Sustainability |
Operation |
Opportunity |
Performance Metrics | ||||
|
RSU awards are subject to Ashtead’s clawback provisions described under “—Compensation Clawback Provisions” below. |
investment, delivering with respect to the dividend policy, maintaining balance sheet health, or other targets relating to sustainability and corporate governance. | |||||||
| Performance Stock Units (PSUs) | PSUs are granted under the LTIP to incentivize the executives to optimize business performance through the economic cycle and to deliver the long-term success of Ashtead’s business strategy while achieving sustainable long-term shareholder value creation.
Ashtead operates in an inherently cyclical business with high capital requirements. The performance measures and targets were chosen to ensure an appropriate dynamic tension between growing earnings ahead of market rates, delivering strong return on investment, creating shareholder value and achieving the sustainability objectives underpinning our corporate purpose. |
Annual awards normally vest subject to achievement of predetermined performance targets and continued employment through the applicable vesting date. Performance is measured over a three-year performance period.
For Mr. Horgan, vested shares (net of taxes) are required to be held for an additional two years following vesting.
The grant levels, performance measures and underlying targets, as well as their weightings, are normally reviewed each year by the Ashtead Remuneration Committee to ensure continued alignment with Ashtead’s long-term strategy for executive directors of Ashtead.
PSUs may include the right to receive dividend equivalents on vested shares.
PSU awards are subject to Ashtead’s clawback provisions described under “—Compensation Clawback Provisions” below. |
The maximum annual PSU award opportunity as a percentage of base salary in respect of a financial year is 700% for Mr. Horgan, 210% for Messrs. Pease and Pratt and 175% for the other named executive officers. | The Ashtead Remuneration Committee selects performance measures and targets for the PSUs intended to align with Ashtead’s strategic priority of delivering sustainable long-term shareholder value creation.
Prior to each grant, the Ashtead Remuneration Committee will select performance measures and targets. The performance measures and targets were chosen to ensure an appropriate dynamic tension between growing earnings ahead of market rates, delivering strong return on investment, creating shareholder value, and achieving the sustainability objectives underpinning Ashtead’s corporate purposes. | ||||
| Pension Benefits, Supplemental Retirement Benefits and Other Benefits | To provide a market competitive package to attract and retain executives. | In relation to pension benefits, contributions (or payment of a salary supplement in lieu of pension contributions) equal to the average available for the workforce in the relevant geography are made to the Ashtead defined contribution pension arrangement.
Other benefits generally include medical insurance, life cover, car allowance and travel and accommodation allowances. The type and level |
Maximum company contribution to a defined contribution pension or cash payment of a salary supplement in lieu of pension contributions, aligned with the average employee contribution in the respective geographies.
For other benefits, the maximum is set at the cost of providing the listed benefits. |
Not applicable. | ||||
93
Table of Contents
| Component |
Purpose and Link to Strategy, Long-term Interests and Sustainability |
Operation |
Opportunity |
Performance Metrics | ||||
| of benefits is reviewed periodically by the Ashtead Remuneration Committee to ensure they remain market competitive. |
Base Salaries
The Ashtead Remuneration Committee’s review of the 2025 base salaries for the named executive officers, which was completed at the end of the fiscal year ended April 30, 2024, considered the performance of Ashtead and the named executive officers, increases in salaries for the wider workforce and the macroeconomic environment. Following this review, the Ashtead Remuneration Committee approved increases effective May 1, 2024 or June 1, 2024, as applicable. The 2025 base salaries for each of the named executive officers and the corresponding percentage increase as compared to the 2024 base salaries for each of the named executive officers are each set forth below (the base salary for Mr. Pease reflects his base salary upon the commencement of his employment in October 2024).
| Named Executive Officer |
2025 Annual Base Salary ($) |
Percentage Increase from 2024 |
||||||
| Brendan Horgan |
1,169,750 | 4% | ||||||
| Alex Pease |
850,000 | N/A | ||||||
| Michael Pratt |
814,881 | * | 4% | |||||
| John Washburn |
502,400 | 11% | ||||||
| Rod Samples |
494,000 | 0% | ||||||
| Brad Lull |
452,400 | 0% | ||||||
| * | Mr. Pratt’s salary was paid in British pounds and has been converted into U.S. dollars at an exchange rate of $1.2813 per £1.00, which represents Ashtead’s average exchange rate for the fiscal year ended April 30, 2025. |
Annual Bonuses
The maximum annual bonus opportunity for each named executive officer, expressed as a percentage of base salary, is reviewed and approved annually by the Ashtead Remuneration Committee. For the fiscal year ended April 30, 2025, no changes were made to the maximum bonus percentages of the named executive officers. However, the dollar value of the 2025 maximum bonus opportunity for Messrs. Horgan, Pratt and Washburn increased as compared to 2024 due to the base salary increases described above.
The maximum bonus opportunity for each of the named executive officers (expressed as a percentage of base salary) is set forth below.
| Full Name |
Maximum Annual Bonus Opportunity |
|||
| Brendan Horgan |
225 | % | ||
| Alex Pease |
175 | % | ||
| Michael Pratt |
175 | % | ||
| John Washburn |
150 | % | ||
| Rod Samples |
150 | % | ||
| Brad Lull |
150 | % | ||
At the beginning of the fiscal year ended April 30, 2025, performance measures and thresholds were established for the annual bonuses, taking into account a range of internal and external factors, including internal forecasts, prior year performance, degree of stretch within the business plan, market conditions and expectations, and sector and regulatory developments. In setting the performance thresholds, the Ashtead Remuneration
94
Table of Contents
Committee also took into account market expectations with regard to future developments in Ashtead’s external environment, which in turn fed into specific objectives based on strategy. The combination of performance measures and thresholds for the incentive arrangements were chosen to create direct alignment to the successful implementation of our strategy, which was intended to incentivize the named executive officers to deliver sustainable long-term shareholder value. The performance measures chosen for the 2025 annual bonuses for Messrs. Horgan, Pease and Pratt were adjusted pre-tax profit (50%) and free cash flow before interest, taxation and capital allocation decisions (50%). The performance measures chosen for the 2025 annual bonuses for Messrs. Washburn, Samples and Lull were North American adjusted operating profit, excluding the impact of IFRS 16 (50%), and North American free cash flow before interest, taxation and capital allocation decisions (50%). The final potential annual bonus payout for each named executive officer was between 0% and 100% of maximum.
The Ashtead Remuneration Committee reviewed performance against the 2025 annual bonus metrics and approved an annual bonus payout of 78.3% of maximum for each of Messrs. Horgan, Pease and Pratt and 79.8% of maximum for each of Messrs. Washburn, Samples and Lull, in each case with one-third of the annual bonus being deferred into DBP awards in accordance with the DBP.
The table below sets forth in further detail the achievement of applicable performance metrics for Messrs. Horgan, Pease and Pratt. Actual financial results disclosed below are based on Ashtead’s financial statements for the fiscal year ended April 30, 2025, as prepared in accordance with International Financial Reporting Standards (IFRS). Given that these results represent the actual performance numbers used by the Ashtead Remuneration Committee to determine and approve the relevant compensatory payments, these numbers have not been revised to conform to GAAP.
| Performance Criteria |
Weighting | Entry (10%) | Threshold (30%) |
Target (50%) | Maximum (100%) |
Actual Performance |
Level of Vesting (as a percentage of maximum) |
|||||||||||||||||||||
| Adjusted pre-tax profit |
50% | $1,985 million | $2,040 million | $2,100 million | $2,335 million | $2,131 million | 56.6% | |||||||||||||||||||||
| Free cash flow before interest, taxation and capital allocation decisions |
50% | $1,745 million | $1,860 million | $1,975 million | $2,325 million | $2,771 million | 100% | |||||||||||||||||||||
|
|
|
|
|
|||||||||||||||||||||||||
| Total |
100% | 78.3% | ||||||||||||||||||||||||||
The table below sets forth in further detail the achievement of applicable performance metrics for Messrs. Washburn, Samples and Lull. Actual financial results disclosed below are based on Ashtead’s financial statements for the fiscal year ended April 30, 2025, as prepared in accordance with IFRS. Given that these results represent the actual performance numbers used by the Ashtead Remuneration Committee to determine and approve the relevant compensatory payments, these numbers have not been revised to conform to GAAP.
| Performance |
Weighting | Entry (10%) | Threshold (30%) |
Target (50%) | Maximum (100%) |
Actual Performance |
Level of Vesting (as a percentage of maximum) |
|||||||||||||||||||||
| North American adjusted operating profit, excluding the impact of IFRS 16 |
50% | $2,375 million | $2,453 million | $2,525 million | $2,805 million | $2,578 million | 59.6% | |||||||||||||||||||||
| North American free cash flow before interest, taxation and capital allocation decisions |
50% | $1,492 million | $1,596 million | $1,690 million | $1,994 million | $2,432 million | 100% | |||||||||||||||||||||
|
|
|
|
|
|||||||||||||||||||||||||
| Total |
100% | 79.8% | ||||||||||||||||||||||||||
95
Table of Contents
The 2025 annual bonus payment for each of the above measures was calculated based on the annual base salary for each named executive officer for the fiscal year ended April 30, 2025, the named executive officer’s maximum annual bonus opportunity (expressed as a percentage of base salary) and the level of vesting determined by the Ashtead Remuneration Committee based on performance as compared to the performance targets. The aggregate 2025 annual bonus amount for each of the named executive officers for the fiscal year ended April 30, 2025 is set forth in the table below.
| Named Executive Officer |
2025 Annual Base Salary ($) |
Maximum Annual Bonus Opportunity |
Level of Vesting (as a percentage of maximum) |
2025 Annual Bonus Amount ($)* |
||||||||||||
| Brendan Horgan |
1,169,750 | 225 | % | 78.3 | % | 2,060,807 | ||||||||||
| Alex Pease** |
850,000 | 175 | % | 78.3 | % | 644,581 | ||||||||||
| Michael Pratt*** |
849,419 | 175 | % | 78.3 | % | 1,163,911 | ||||||||||
| John Washburn |
502,400 | 150 | % | 79.8 | % | 601,373 | ||||||||||
| Rod Samples |
494,000 | 150 | % | 79.8 | % | 591,318 | ||||||||||
| Brad Lull |
452,400 | 150 | % | 79.8 | % | 541,523 | ||||||||||
| * | Two-thirds of the 2025 annual bonus amount was paid in cash following the end of the fiscal year ended April 30, 2025 and one-third was deferred into DBP awards in accordance with the DBP. |
| ** | The 2025 annual bonus amount for Mr. Pease was pro-rated based on his employment commencement date in October 2024. |
| *** | Amounts for Mr. Pratt have been converted into U.S. dollars at an exchange rate of $1.3356 per £1.00, which represents a spot exchange rate on April 30, 2025 of $1.3356 per £1.00. |
Equity Awards
Equity Awards Granted in 2025
Ashtead’s long-term incentive program for 2025 includes two equity awards vehicles: RSUs and PSUs. The awards are designed to motivate and incentivize executives to create sustainable long-term value, attract and retain top talent and align executive and shareholder interests through a meaningful ownership stake.
Annual long-term incentive awards represent the largest portion of each named executive officer’s total annual compensation opportunity. The Ashtead Remuneration Committee considers various factors for determining the size and mix of annual equity awards for the named executive officers, including long-term business objectives, market practices and individual performance. For the fiscal year ended April 30, 2025, the aggregate maximum grant date fair value of annual long-term incentive awards for each of the named executive officers (expressed as a percentage of base salary) is set forth below.
| Full Name |
Maximum Annual Long-Term Incentive Awards |
|||
| Brendan Horgan |
850 | % | ||
| Alex Pease |
300 | % | ||
| Michael Pratt |
300 | % | ||
| John Washburn |
250 | % | ||
| Rod Samples |
250 | % | ||
| Brad Lull |
250 | % | ||
In the fiscal year ended April 30, 2025, once the total annual long-term incentive award amount for each named executive officer was determined by the Ashtead Remuneration Committee, RSUs and PSUs were granted in the following mix to each of the named executive officers: for Mr. Horgan, 18% was granted in RSUs and 82% was granted in PSUs; for Messrs. Pease, Washburn, Samples and Lull, 30% was granted in RSUs and 70% was granted in PSUs; and for Mr. Pratt, 100% was granted in PSUs.
PSUs. At the beginning of the fiscal year ended April 30, 2025, performance measures and thresholds were established for the PSU awards, taking into account a range of internal and external factors, including internal forecasts, prior year performance, degree of stretch within the business plan, market conditions and expectations,
96
Table of Contents
and sector and regulatory developments. In setting the performance thresholds, the Ashtead Remuneration Committee also took into account market expectations with regards to future developments in Ashtead’s external environment, which in turn fed into specific objectives based on strategy. The combination of performance measures and thresholds for the incentive arrangements were chosen to create direct alignment to the successful implementation of our strategy, which was intended to incentivize the named executive officers to deliver sustainable long-term shareholder value. The performance measures chosen for PSUs granted in 2025 were relative total shareholder return (TSR) (30%), compound adjusted earnings per share growth (30%), adjusted return on investment (30%) and carbon intensity reduction (10%).
The number of shares, if any, earned with respect to each of the performance measures applicable to the PSUs will be calculated based on our performance (as compared to such pre-determined performance measures and targets) and awarded to named executive officers independently from the other performance measures. In addition, named executive officers must generally remain continuously employed through the end of the performance period in order to earn any PSUs.
The final potential payout with regard to the PSUs is between 0% and 100% of maximum. These awards generally vest following a three-year performance period, to the extent performance is achieved upon completion of the performance period, and for Mr. Horgan, vested shares (net of tax) are required to be held for a further two-year period post-vesting. With respect to PSUs, dividend equivalents accrue over the vesting period, but are paid out only with regard to vested shares.
RSUs. RSUs generally vest in equal annual installments over three years, subject to continued employment through the applicable vesting date (and, in the case of Messrs. Horgan and Pratt, achievement of an underpin) and, for Mr. Horgan, vested shares (net of tax) are required to be held for a further one-year period post-vesting.
Performance-Based Equity Award Results for Performance Periods Ending in 2025
The PSUs for the performance period May 1, 2022 through April 30, 2025, which service-vested on July 4, 2025, were based on the following performance measures: relative TSR (40%); compound adjusted earnings per share growth (25%); adjusted return on investment (25%); and net debt to adjusted EBITDA (10%). Based on Ashtead’s performance during the performance period, the Ashtead Renumeration Committee determined that the PSUs would vest at 40.6% of maximum for Messrs. Horgan and Pratt and at 60.6% for Messrs. Washburn, Samples and Lull.
The table below shows detailed performance results for the PSUs for the performance period May 1, 2022 through April 30, 2025. Actual financial results disclosed below are based on Ashtead’s financial statements for the fiscal year ended April 30, 2025, as prepared in accordance with IFRS. Given that these results represent the actual performance numbers used by the Ashtead Remuneration Committee to determine and approve the relevant compensatory payments, these numbers have not been revised to conform to GAAP.
| Performance Criteria |
Weighting | Target (25%) | Maximum (100%) | Actual Performance |
Level of Vesting (as a percentage of maximum) |
|||||||||||||||
| Relative TSR (1) |
40% | Median | Upper Quartile | Below Median | — | |||||||||||||||
| Compound adjusted earnings per share growth |
25% | 6% | 12% | 6.36% | 29.5% | |||||||||||||||
| Adjusted return on investment |
25% | 10% | 15% | 14.5% | 93% | |||||||||||||||
| Net debt to adjusted EBITDA |
10% | — | <2 | 1.7 | 100% | |||||||||||||||
|
|
|
|
|
|||||||||||||||||
| Total |
100% | 40.6% | ||||||||||||||||||
| (1) | The peer group used for the TSR measure comprised the constituents of the Financial Times Stock Exchange (FTSE) 100 (excluding investment funds) on May 1, 2022. TSR performance has been determined by Ellason LLP, the Ashtead Remuneration Committee’s independent compensation consultant (Ellason), on a basis consistent with prior years, removing all delisted companies from the list of peers and using a one-month average TSR index immediately prior to both the start and end of the performance period. |
97
Table of Contents
Notwithstanding the above, with respect to Messrs. Washburn, Samples and Lull, the Ashtead Remuneration Committee exercised its discretion to provide that the relative TSR component of the PSUs would instead vest at 50% of maximum, as performance for such component was adversely affected in the final quarter of the performance period in light of broader economic uncertainties and sentiment (prior to which, the component had achieved target or greater performance in each quarter of the performance period). As a result of the Ashtead Remuneration Committee’s exercise of its direction, the overall level of vesting for the PSUs held by Messrs. Washburn, Samples and Lull was determined to be 60.6% of maximum.
Equity Award Timing Policies and Practices
Ashtead does not grant equity awards in anticipation of the release of material non-public information or time the release of material non-public information based on equity award grant dates or for the purpose of affecting the value of executive compensation. In addition, Ashtead does not take material non-public information into account when determining the timing and terms of such awards. Although Ashtead does not have a formal policy with respect to the timing of our equity award grants, the Ashtead Remuneration Committee has historically granted such awards on a predetermined annual schedule. In the fiscal year ended April 30, 2025, Ashtead did not grant new awards of stock options, stock appreciation rights, or similar option-like instruments to the named executive officers.
Pension and Supplemental Retirement Plans
Sunbelt Rentals, Inc. maintains the Sunbelt Rentals, Inc. Retirement Savings Plan (the 401(k) Plan), which is a defined contribution plan for the benefit of its eligible U.S. employees, under which Messrs. Horgan, Pease, Washburn, Samples and Lull are eligible to participate. While the terms of the 401(k) Plan provide for certain employer contributions, none of Messrs. Horgan, Pease, Washburn, Samples or Lull received any such contributions during the fiscal year ended April 30, 2025 as a result of U.S. Internal Revenue Service limitations on qualified plans.
Sunbelt Rentals, Inc. maintains the Executive Non-Qualified Excess Plan of Sunbelt Rentals, Inc. (the NQDC Plan) for certain employees, including the named executive officers other than Mr. Pratt, under which participants may elect to defer all or a portion of their eligible compensation. For a description of the NQDC Plan, see “—Executive Compensation Tables—2025 Nonqualified Deferred Compensation” below.
In lieu of contributions to Ashtead’s frozen U.K. defined benefit pension plan (in which Mr. Pratt does not participate), Ashtead paid Mr. Pratt a cash payment equal to 6% of his base salary.
Other Executive Benefits and Perquisites
Ashtead and its subsidiaries provide the named executive officers with a limited number of executive benefits and perquisites, which are designed to be competitive with market practices and contribute to our efforts to attract and retain highly skilled executives. For additional details, see “—Executive Compensation Tables—2025 Summary Compensation Table” below.
In addition, Ashtead provided named executive officers with use of chartered aircraft primarily for business purposes, with limited use for personal purposes on an ad hoc basis. Chartered aircraft travel allows for the safety and privacy of the named executive officers and allows the named executive officers to be more productive than if commercial flights were utilized, as the aircraft provides a conducive and more confidential business environment without the scheduling constraints imposed by commercial airline services.
Employment Arrangements
Ashtead and its subsidiaries are party to employment agreements with each of the named executive officers, which provide for, in certain cases, severance benefits and payments upon certain qualifying terminations of
98
Table of Contents
employment. In addition, in connection with Mr. Pratt’s retirement from serving as Chief Financial Officer, Ashtead entered into a letter agreement with him on May 28, 2025 (the Pratt Letter Agreement) formalizing the applicable dates for Mr. Pratt’s notice period (including compensation to be paid during and upon the cessation of the notice period) and other transitional matters. For additional details, see “—Executive Compensation Tables—2025 Potential Payments upon Termination or Change in Control” below.
Executive Share Ownership Requirements
To align the interests of named executive officers with those of stockholders and incentivize long-term performance, the named executive officers are subject to certain shareholding requirements. The Chief Executive Officer is required to build a minimum shareholding equivalent to 850% of his base salary and each of the other named executive officers a minimum shareholding equivalent to 300% of their base salary. The Ashtead Remuneration Committee requires the named executive officers to build and maintain a material shareholding in Ashtead over a reasonable time frame, typically five years. The named executive officers will normally also be subject to a post-cessation shareholding requirement. The shareholding requirement will apply for two years following the named executive officer’s departure; during such period the Chief Executive Officer is required to maintain a minimum shareholding equivalent to 300% of his base salary and each of the other named executive officers a minimum shareholding equivalent to 200% of their base salary.
Compensation Clawback Provisions
Executive compensation recoupment may be enforced in each of the following circumstances:
| • | a material misstatement of accounts; |
| • | where the payout with respect to an executive compensation award was determined by reference to an assessment of a performance condition which was based on an error, or inaccurate or misleading information; |
| • | action or conduct by an award holder or award holders that, in the reasonable opinion of the Ashtead Board of Directors, amounts to fraud or gross misconduct; |
| • | censure by a regulatory body or significant detrimental impact to the reputation of Ashtead and its subsidiaries (whether the participant was responsible for, or had management oversight over, the actions, omissions or behavior that gave rise to that censure or detrimental impact); or |
| • | corporate failure. |
These clawback provisions may be enforced in respect of amounts payable under the DBP for two years following payment and in respect of RSU and PSU awards for five years from grant.
Roles of the Ashtead Remuneration Committee
The principal roles of the Ashtead Remuneration Committee include the following:
| • | determine and agree with the Ashtead Board of Directors the framework and policy for the compensation of the chair, executive officers and senior employees; |
| • | ensure that executive management is provided with appropriate incentives to encourage enhanced performance in a fair and responsible manner; |
| • | review and determine the total compensation packages for each executive officer, including bonuses and incentive plans; |
| • | determine the policy for and scope of pension arrangements, service agreements, termination payments and compensation commitments for each of the executive officers; and |
| • | ensure compliance with all statutory and regulatory provisions. |
99
Table of Contents
The Ashtead Remuneration Committee was, as of April 30, 2025, chaired by Lucinda Riches and currently comprises six non-executive directors, including the Chair of the Ashtead Remuneration Committee. The Ashtead Remuneration Committee receives advice from independent remuneration consultants, as appropriate, to supplement its knowledge and to keep the committee updated on current trends and practices. In the fiscal year ended April 30, 2025, the Ashtead Remuneration Committee received advice from its independent advisors, Ellason, in relation to the external governance landscape and on the approach to executive compensation going forward. The Ashtead Remuneration Committee determined that the advice provided by Ellason, which does not have any other affiliation with Ashtead, was objective and independent. An internal evaluation of the Ashtead Remuneration Committee was undertaken in 2025. The conclusion from that process was that the performance of the Ashtead Remuneration Committee and its Chair were satisfactory.
Benchmarking Compensation to Peers
In 2025, Ellason conducted a competitive market analysis of executive pay opportunities against two comparator groups recommended by Ellason: (i) a comparator group of U.S. listed companies representing companies with a comparable scale and industry; and (ii) a comparator group of FTSE 50 companies, excluding financial services. The comparator groups were consistent with those utilized by Ashtead for 2024.
Comparator groups were comprised of the following companies:
| U.S. Peers |
FTSE 50 | |
| Trane Technologies |
AstraZeneca | |
| Waste Management |
Shell | |
| Parker-Hannifin |
Unilever | |
| Cintas Corp |
Rio Tinto | |
| Republic Services |
RELX | |
| WW Grainger |
BP | |
| United Rentals |
British American Tobacco | |
| Waste Connections |
GSK | |
| Rockwell Automation |
Diageo | |
| Xylem |
National Grid | |
| Dover Corp |
Glencore | |
| Fortive Corp |
Rolls-Royce Holdings | |
| JB Hunt Transport Services |
Compass | |
| Masco Corp |
BAE Systems | |
| Stanley Black & Decker |
Experian | |
| CH Robinson Worldwide |
Haleon | |
| WESCO International |
Reckitt Benckiser | |
| WillScot Holdings |
Anglo American | |
| Ryder System |
Tesco | |
| Herc Holdings |
Imperial Brands | |
| SSE | ||
| Vodafone Group | ||
| Antofagasta | ||
| Associated British Foods | ||
| InterContinental Hotels | ||
| BT Group | ||
| Next | ||
| IAG | ||
| Bunzl | ||
| Sage Group | ||
| Informa |
100
Table of Contents
| U.S. Peers |
FTSE 50 | |
| Coca-Cola | ||
| Halma | ||
| Rentokil Initial | ||
| Smith & Nephew | ||
| WPP |
Because comparative compensation information represents just one of the several analytic tools used in setting executive compensation, the Ashtead Remuneration Committee has discretion in determining the nature and extent of its use. Further, given the limitations associated with comparative pay information for setting individual executive compensation, including the difficulty of assessing and comparing wealth accumulation through equity gains and post-employment amounts at other companies, the Ashtead Remuneration Committee may elect to not use the comparative compensation information at all in the course of making compensation decisions. Furthermore, the Ashtead Remuneration Committee considers other factors as part of the compensation decision process such as individual and company performance, experience, tenure, scope of the role, contribution, succession planning, and retention, among other factors unique to an individual or role. Based on these considerations, the Ashtead Remuneration Committee may decide to set compensation above or below median peer group levels.
Remuneration Committee Interlocks and Insider Participation
The Ashtead Remuneration Committee was, as of April 30, 2025, composed of six independent directors: Lucinda Riches (chair), Angus Cockburn, Jill Easterbrook, Renata Ribeiro, Tanya Fratto and Roy Twite (was appointed to the Ashtead Board of Directors in June 2024). Former Ashtead Remuneration Committee member Lindsley Ruth stepped down from the Ashtead Board of Directors in September 2024. No member of the Ashtead Remuneration Committee is, or was during 2025, a current or former officer or employee of Ashtead or any of its subsidiaries. Additionally, during the fiscal year ended April 30, 2025, none of Ashtead’s executive officers served on the board of directors or compensation committee of any entity that had one or more of its executive officers serving on the Ashtead Board of Directors or Ashtead Remuneration Committee.
Executive Compensation Tables
2025 Summary Compensation Table
The following table sets forth information concerning the compensation of our named executive officers for the fiscal year ended April 30, 2025.
| Name and Principal Position |
Fiscal Year |
Salary ($) |
Bonus ($) |
Stock Awards ($) (1) |
Non-Equity Incentive Plan Compensation ($) |
Change in Pension Value and Nonqualified Deferred Compensation Earnings ($) |
All Other Compensation ($) (2) |
Total ($) | ||||||||||||||||||||||||
| (a) | (b) | (c) | (d) | (e) | (g) | (h) | (i) | (j) | ||||||||||||||||||||||||
| Brendan Horgan |
2025 | 1,169,750 | — | 9,492,362 | 1,373,871 | — | 89,864 | 12,125,847 | ||||||||||||||||||||||||
| Chief Executive Officer |
||||||||||||||||||||||||||||||||
| Alex Pease |
2025 | 470,411 | — | 2,680,515 | 429,720 | — | 352,165 | 3,932,811 | ||||||||||||||||||||||||
| Chief Financial Officer |
||||||||||||||||||||||||||||||||
| Michael Pratt (3) |
2025 | 814,881 | — | 2,533,818 | 775,941 | — | 72,303 | 4,196,943 | ||||||||||||||||||||||||
| Former Chief Financial Officer |
||||||||||||||||||||||||||||||||
| John Washburn |
2025 | 502,400 | — | 1,338,008 | 400,915 | — | 34,071 | 2,275,394 | ||||||||||||||||||||||||
101
Table of Contents
| Name and Principal Position |
Fiscal Year |
Salary ($) |
Bonus ($) |
Stock Awards ($) (1) |
Non-Equity Incentive Plan Compensation ($) |
Change in Pension Value and Nonqualified Deferred Compensation Earnings ($) |
All Other Compensation ($) (2) |
Total ($) | ||||||||||||||||||||||||
| (a) | (b) | (c) | (d) | (e) | (g) | (h) | (i) | (j) | ||||||||||||||||||||||||
| Chief Operations Officer |
||||||||||||||||||||||||||||||||
| Rod Samples |
2025 | 494,000 | — | 1,315,616 | 394,212 | — | 53,544 | 2,257,372 | ||||||||||||||||||||||||
| Chief Administration Officer |
||||||||||||||||||||||||||||||||
| Brad Lull |
2025 | 452,400 | — | 1,204,864 | 361,015 | — | 44,397 | 2,062,676 | ||||||||||||||||||||||||
| Executive Vice President, Business Development & Strategy
|
||||||||||||||||||||||||||||||||
| (1) | Amounts reflect the aggregate grant date fair value of stock awards granted under the LTIP and DBP awards granted under the DBP, in each case computed in accordance with the Financial Accounting Standards Board Accounting Standards Codification Topic 718 (FASB ASC Topic 718). The aggregate grant date fair value does not take into account any estimated forfeitures related to service vesting conditions. The amounts reported in this column reflect the accounting cost for such awards and do not correspond to the actual economic value that may be received by our named executive officers upon the vesting or settlement of such awards. We provide information regarding the assumptions used to calculate the grant date fair value of all such awards granted to named executive officers in Note 16 to our audited consolidated financial statements included elsewhere in this Registration Statement. Amounts with respect to PSUs granted by us during the fiscal year ended April 30, 2025 reflect the grant date fair value calculated in accordance with FASB ASC Topic 718 based on the probable outcome of the applicable performance goals, excluding the effect of estimated forfeitures. The grant date fair value of such PSUs assuming maximum achievement of the applicable performance goals is as follows: $8,188,250 for Mr. Horgan; $1,785,011 for Mr. Pease; $2,447,264 for Mr. Pratt; $879,206 for Mr. Washburn; $864,454 for Mr. Samples; and $791,727 for Mr. Lull. All amounts have been converted into U.S. dollars based on the spot exchange rate on the applicable grant date, which ranged from $1.2686 per £1.00 to $1.3356 per £1.00. |
| (2) | Figures set forth in the “All Other Compensation” column are comprised of the following: |
| Name and |
Year | Employer Contributions to Non- Qualified Deferred Compensation Plan ($)(a) |
Cash Payment in Lieu of Pension Contributions ($)(b) |
Company Car or Car Allowance ($)(c) |
Employer- Paid Life Insurance Premiums ($)(d) |
Employer Contribution to Private Healthcare Coverage ($)(e) |
Relocation Reimbursement ($)(f) |
Personal Usage of Company Provided Aircraft($)(g) |
Tax Planning and Preparation Services ($)(h) |
Total ($) | ||||||||||||||||||||||||||||||
| Brendan Horgan |
2025 | 30,673 | — | 13,919 | 8,312 | — | — | — | 36,960 | 89,864 | ||||||||||||||||||||||||||||||
| Alex Pease |
2025 | 41,231 | — | 4,200 | 105 | — | 293,144 | 13,485 | — | 352,165 | ||||||||||||||||||||||||||||||
| Michael Pratt |
2025 | — | 48,893 | 7,823 | — | 1,207 | — | — | 14,380 | 72,303 | ||||||||||||||||||||||||||||||
| John Washburn |
2025 | 30,673 | — | 862 | 2,536 | — | — | — | — | 34,071 | ||||||||||||||||||||||||||||||
| Rod Samples |
2025 | 34,100 | — | 9,800 | 9,644 | — | — | — | — | 53,544 | ||||||||||||||||||||||||||||||
102
Table of Contents
| Name and Position |
Year | Employer Contributions to Non- Qualified Deferred Compensation Plan ($)(a) |
Cash Payment in Lieu of Pension Contributions ($)(b) |
Company Car or Car Allowance ($)(c) |
Employer- Paid Life Insurance Premiums ($)(d) |
Employer Contribution to Private Healthcare Coverage ($)(e) |
Relocation Reimbursement ($)(f) |
Personal Usage of Company Provided Aircraft($)(g) |
Tax Planning and Preparation Services ($)(h) |
Total ($) | ||||||||||||||||||||||||||||||
| Brad Lull |
2025 | 30,500 | — | 12,671 | 1,226 | — | — | — | — | 44,397 | ||||||||||||||||||||||||||||||
| (a) | Represents employer contributions to the NQDC Plan. |
| (b) | Represents cash payment equal to 6% of Mr. Pratt’s base salary in lieu of company contributions to our U.K. defined pension arrangement. |
| (c) | For Messrs. Horgan, Washburn and Lull, represents the aggregate incremental cost of providing a company car. For Messrs. Pease, Pratt and Samples, represents car allowance. |
| (d) | Represents employer-paid life insurance premiums. |
| (e) | Represents employer contributions to UK private healthcare coverage. |
| (f) | Represents reimbursement of relocation costs in connection with the commencement of Mr. Pease’s employment. |
| (g) | Represents aggregate incremental cost attributable to personal usage of company-provided aircraft, consisting of the hourly leasing rate and fuel costs. |
| (h) | Represents amounts paid or reimbursed by Ashtead related to tax planning and the preparation of various tax returns. |
| (3) | For Mr. Pratt, all cash amounts were paid in British pounds and converted into U.S. dollars at an exchange rate as follows: (i) for figures in the Salary column, $1.2813 per £1.00, which represents Ashtead’s average exchange rate for fiscal year 2025; (ii) for figures in the Non-Equity Incentive Plan Compensation column, $1.3356 per £1.00, which represents the spot exchange rate on April 30, 2025; and (iii) for figures in the All Other Compensation column, $1.2813 per £1.00, which represents Ashtead’s average exchange rate for fiscal year 2025. |
2025 Grants of Plan-Based Awards
The following table sets forth information regarding each non-equity incentive plan award and each equity incentive award granted to our named executive officers during the fiscal year ended April 30, 2025.
| Estimated Future Payouts Under Non-Equity Incentive Plan Awards(1) |
Estimated Future Payouts Under Equity Incentive Plan Awards(2) |
All Other Stock Awards: Number of Shares of Stock or Units (#) |
Grant Date Fair Value of Stock Awards ($)(5) |
|||||||||||||||||||||||||||||||||
| Name |
Grant Date |
Threshold ($) |
Target ($) |
Maximum ($) |
Threshold (#) |
Target (#) |
Maximum (#) |
|||||||||||||||||||||||||||||
| (a) | (b) | (c) | (d) | (e) | (f) | (g) | (h) | (i) | (j) | |||||||||||||||||||||||||||
| Brendan Horgan |
5/1/24 | 526,388 | 877,312 | 1,754,625 | — | — | — | — | — | |||||||||||||||||||||||||||
| 6/20/24 | — | — | — | — | 14,848 | 59,390 | — | 3,620,944 | ||||||||||||||||||||||||||||
| 9/19/24 | — | — | — | — | 13,365 | 53,459 | — | 3,500,576 | ||||||||||||||||||||||||||||
| 9/19/24 | (3) | — | — | — | — | — | — | 22,911 | 1,683,907 | |||||||||||||||||||||||||||
| 4/30/25 | (4) | — | — | — | — | — | — | 12,890 | 686,936 | |||||||||||||||||||||||||||
| Alex Pease |
10/11/24 | 164,645 | 274,407 | 548,813 | — | — | — | — | — | |||||||||||||||||||||||||||
| 10/11/24 | — | — | — | — | 5,971 | 23,884 | — | 1,732,235 | ||||||||||||||||||||||||||||
| 10/11/24 | (3) | — | — | — | — | — | — | 10,236 | 733,420 | |||||||||||||||||||||||||||
| 4/30/25 | (4) | — | — | — | — | — | — | 4,032 | 214,860 | |||||||||||||||||||||||||||
103
Table of Contents
| Estimated Future Payouts Under Non-Equity Incentive Plan Awards(1) |
Estimated Future Payouts Under Equity Incentive Plan Awards(2) |
All Other Stock Awards: Number of Shares of Stock or Units (#) |
Grant Date Fair Value of Stock Awards ($)(5) |
|||||||||||||||||||||||||||||||||
| Name |
Grant Date |
Threshold ($) |
Target ($) |
Maximum ($) |
Threshold (#) |
Target (#) |
Maximum (#) |
|||||||||||||||||||||||||||||
| (a) | (b) | (c) | (d) | (e) | (f) | (g) | (h) | (i) | (j) | |||||||||||||||||||||||||||
| Michael Pratt |
5/1/24 | 297,297 | 495,495 | 990,989 | — | — | — | — | — | |||||||||||||||||||||||||||
| 6/20/24 | — | — | — | — | 6,583 | 26,333 | — | 1,605,494 | ||||||||||||||||||||||||||||
| 9/19/24 | — | — | — | — | 2,063 | 8,252 | — | 540,353 | ||||||||||||||||||||||||||||
| 4/30/25 | (4) | — | — | — | — | — | — | 7,280 | 387,970 | |||||||||||||||||||||||||||
| John Washburn |
5/1/24 | 150,720 | 251,200 | 502,400 | — | — | — | — | — | |||||||||||||||||||||||||||
| 6/20/24 | — | — | — | — | 3,189 | 12,754 | — | 777,598 | ||||||||||||||||||||||||||||
| 9/19/24 | (3) | — | — | — | — | — | — | 5,466 | 359,953 | |||||||||||||||||||||||||||
| 4/30/25 | (4) | — | — | — | — | — | — | 3,762 | 200,458 | |||||||||||||||||||||||||||
| Rod Samples |
5/1/24 | 148,200 | 247,000 | 494,000 | — | — | — | — | — | |||||||||||||||||||||||||||
| 6/20/24 | — | — | — | — | 3,135 | 12,540 | — | 764,550 | ||||||||||||||||||||||||||||
| 9/19/24 | (3) | — | — | — | — | — | — | 5,375 | 353,960 | |||||||||||||||||||||||||||
| 4/30/25 | (4) | — | — | — | — | — | — | 3,699 | 197,106 | |||||||||||||||||||||||||||
| Brad Lull |
5/1/24 | 135,720 | 226,200 | 452,400 | — | — | — | — | — | |||||||||||||||||||||||||||
| 6/20/24 | — | — | — | — | 2,871 | 11,485 | — | 700,228 | ||||||||||||||||||||||||||||
| 9/19/24 | (3) | — | — | — | — | — | — | 4,922 | 324,129 | |||||||||||||||||||||||||||
| 4/30/25 | (4) | — | — | — | — | — | — | 3,387 | 180,508 | |||||||||||||||||||||||||||
| (1) | Represents two-thirds of the annual bonus for the fiscal year ended April 30, 2025 granted pursuant to the DBP and payable in cash. As described above, the remaining one-third of the bonus was awarded in the form of DBP awards pursuant to the DBP on April 30, 2025, subject to service-based vesting. For Mr. Pease, amounts are pro-rated based on his employment commencement date in October 2024. For Mr. Pratt, amounts were originally denominated in British pounds and have been converted into U.S. dollars at an exchange rate of $1.3356 per £1.00, which represents the spot exchange rate on April 30, 2025. |
| (2) | Represents PSUs granted pursuant to the LTIP. A description of the corresponding vesting conditions is set forth in “—Outstanding Equity Awards at 2025 Fiscal Year-End” below. |
| (3) | Represents RSUs granted pursuant to the LTIP. A description of the corresponding vesting conditions is set forth in “—Outstanding Equity Awards at 2025 Fiscal Year-End” below. |
| (4) | Represents DBP awards granted pursuant to the DBP on April 30, 2025 in respect of one-third of the annual bonus for the fiscal year ended April 30, 2025. A description of the corresponding vesting conditions is set forth in “—Outstanding Equity Awards at 2025 Fiscal Year-End” below. |
| (5) | All amounts have been converted into U.S. dollars based on the spot exchange rate on the applicable grant date, which ranged from $1.2686 per £1.00 to $1.3356 per £1.00. |
104
Table of Contents
Outstanding Equity Awards at 2025 Fiscal Year-End
The following table sets forth information regarding outstanding equity awards held by each of our named executive officers as of fiscal year-end April 30, 2025.
| Stock Awards | ||||||||||||||||||||
| Name (a) |
Grant Date (b) |
Number of Shares or Units of Stock That Have Not Vested (#) (c) |
Market Value of Shares or Units of Stock That Have Not Vested ($) (d)(6) |
Equity Incentive Plan Awards: Number of Unearned Shares, Units or Other Rights That Have Not Vested (#) (e) |
Equity Incentive Plan Awards: Market or Payout Value of Unearned Shares, Units or Other Rights That Have Not Vested ($) (f)(6) |
|||||||||||||||
| Brendan Horgan |
4/30/25 | (5) | 12,890 | 686,936 | — | — | ||||||||||||||
| 9/19/24 | (2) | — | — | 53,459 | 2,848,854 | |||||||||||||||
| 9/19/24 | (3) | 22,911 | 1,220,937 | — | — | |||||||||||||||
| 6/20/24 | (2) | — | — | 59,390 | 3,164,919 | |||||||||||||||
| 4/30/24 | (5) | 1,251 | 66,657 | — | — | |||||||||||||||
| 6/19/23 | (2) | — | — | 57,247 | 3,050,718 | |||||||||||||||
| 7/4/22 | (4) | 36,509 | 1,945,581 | — | — | |||||||||||||||
| Alex Pease |
4/30/25 | (5) | 4,032 | 214,860 | — | — | ||||||||||||||
| 10/11/24 | (2) | — | — | 23,884 | 1,272,789 | |||||||||||||||
| 10/11/24 | (3) | 10,236 | 545,481 | — | — | |||||||||||||||
| Michael Pratt |
4/30/25 | (5) | 7,280 | 387,970 | — | — | ||||||||||||||
| 9/19/24 | (2) | — | — | 8,252 | 439,753 | |||||||||||||||
| 6/20/24 | (2) | — | — | 26,333 | 1,403,297 | |||||||||||||||
| 4/30/24 | (5) | 639 | 34,035 | — | — | |||||||||||||||
| 6/19/23 | (2) | — | — | 25,603 | 1,364,395 | |||||||||||||||
| 7/4/22 | (4) | 15,462 | 823,977 | — | — | |||||||||||||||
| John Washburn |
4/30/25 | (5) | 3,762 | 200,458 | — | — | ||||||||||||||
| 6/20/24 | (2) | — | — | 12,754 | 679,666 | |||||||||||||||
| 6/20/24 | (1) | 5,466 | 291,286 | — | — | |||||||||||||||
| 4/30/24 | (5) | 531 | 28,318 | — | — | |||||||||||||||
| 6/19/23 | (2) | — | — | 9,868 | 525,870 | |||||||||||||||
| 7/4/22 | (4) | 8,638 | 460,323 | — | — | |||||||||||||||
| Rod Samples |
4/30/25 | (5) | 3,699 | 197,106 | — | — | ||||||||||||||
| 6/20/24 | (2) | — | — | 12,540 | 668,262 | |||||||||||||||
| 6/20/24 | (1) | 5,375 | 286,436 | — | — | |||||||||||||||
| 4/30/24 | (5) | 523 | 27,886 | — | — | |||||||||||||||
| 6/19/23 | (2) | — | — | 10,776 | 574,258 | |||||||||||||||
| 7/4/22 | (4) | 10,258 | 546,653 | — | — | |||||||||||||||
| Brad Lull |
4/30/25 | (5) | 3,387 | 180,508 | — | — | ||||||||||||||
| 6/20/24 | (2) | — | — | 11,485 | 612,041 | |||||||||||||||
| 6/20/24 | (1) | 4,922 | 262,296 | — | — | |||||||||||||||
| 4/30/24 | (5) | 479 | 25,513 | — | — | |||||||||||||||
| 6/19/23 | (2) | — | — | 9,868 | 525,870 | |||||||||||||||
| 7/4/22 | (4) | 9,394 | 500,610 | — | — | |||||||||||||||
| (1) | Represents RSUs that generally vest in equal installments on each of the first three anniversaries of the grant date, subject to continued employment through each applicable vesting date. |
| (2) | Represents PSUs that generally vest based on achievement of applicable performance goals over the applicable three-year performance period and continued employment through the third anniversary of the grant date (or, for PSUs granted in September or October 2024, continued employment through June 20, 2027). For purposes of the table above, PSUs are reflected assuming maximum level of performance achievement (100% of maximum opportunity). |
105
Table of Contents
| (3) | Represents RSUs that generally vest in equal installments on each of the second, third and fourth anniversaries of the grant date, subject to continued employment through each applicable vesting date. |
| (4) | Represents PSUs for which the applicable three-year performance period concluded as of April 30, 2025 (based on actual achievement of applicable performance goals), which vested on July 4, 2025. |
| (5) | Represents unvested portion of DBP awards that are generally eligible to vest subject to continued employment through April 30, 2026. |
| (6) | Value based on the applicable number of shares or units underlying an award as reflected above, multiplied by $53.29, which is the closing market price of a share of Ashtead common stock as of April 30, 2025 (£39.90) converted into U.S. dollars at an exchange rate of $1.3356 per £1.00, which represents the spot exchange rate on April 30, 2025. |
2025 Option Exercises and Stock Vested
The following table sets forth information regarding vesting of stock awards held by each of our named executive officers during the fiscal year ended April 30, 2025. None of our named executive officers held stock options during the fiscal year ended April 30, 2025.
| Stock Awards | ||||||||
| Name (a) |
Number of Shares Acquired on Vesting (#) (b) |
Value Realized on Vesting ($) (c) |
||||||
| Brendan Horgan |
77,063 | 5,175,025 | ||||||
| Alex Pease |
— | — | ||||||
| Michael Pratt |
43,346 | 2,903,911 | ||||||
| John Washburn |
23,637 | 1,603,042 | ||||||
| Rod Samples |
25,301 | 1,710,948 | ||||||
| Brad Lull |
23,637 | 1,597,394 | ||||||
| (1) | Value based on the number of shares or units underlying awards that vested during the fiscal year ended April 30, 2025, multiplied by the closing market price of a share of Ashtead common stock for the date on which the applicable award vested. All amounts have been converted into U.S. dollars based on the spot exchange rate on the applicable vesting date, which ranged from $1.2798 per £1.00 to $1.3356 per £1.00. Figures are inclusive of the value of DBP awards that vested during the fiscal year ended April 30, 2025; however, the number of units underlying such DBP awards that vested during the fiscal year ended April 30, 2025 are not reported in the “Numbers of Shares Acquired on Vesting” column since such DBP awards vested were settled in cash. For a description of the treatment of the DBP awards, see “—Elements of Compensation” above. |
| (2) | Although not included in the table above, the value of cash dividend equivalents paid on vested PSUs to each of the named executive officers (other than Mr. Pease) were equal to the following, which amounts were converted to U.S. dollars at an exchange rate of $1.2798 per £1.00, which represents conversion into U.S. dollars based on the spot exchange rate on the applicable vesting date: Mr. Horgan – $170,599; Mr. Pratt – $96,506; Mr. Washburn – $58,496; Mr. Samples – $62,614; and Mr. Lull – $58,496. |
2025 Nonqualified Deferred Compensation
Under the NQDC Plan, our named executive officers (other than Mr. Pratt) and other members of senior management may defer base pay, cash incentive compensation and certain equity awards into an account that is deemed invested in one or more available investment funds, which funds provide investment options similar to the investment options provided under the 401(k) Plan. Deferred equity awards in all events are represented by Ashtead Shares. Participants make deferral elections with respect to cash pay and equity awards before the year in which such pay is earned or such equity awards vest. The NQDC Plan is not funded and, as a result, NQDC Plan account balances are subject to the claims of our creditors.
Subject to certain limitations, participants can defer (a) up to 100% of their cash pay and (b) up to 100% of the shares subject to their equity awards upon vesting. Employer contributions are discretionary; however, for the fiscal year ended April 30, 2025, employer contributions were made based on a 100% match of a participant’s contributions up to the participant’s annual Internal Revenue Code 402(g) limit for the applicable calendar years. Employer contributions are deemed invested in accordance with the participant’s election as to his or her own contributions.
106
Table of Contents
Participant contributions are 100% vested at all times, while employer contributions are eligible to vest 20% for each year of completed service, such that employer contributions are 100% vested upon a participant reaching five years of completed service. In addition, employer contributions fully accelerate in vesting upon the occurrence of a change in control event (within the meaning of the NQDC Plan) or the participant’s death, disability or attainment of age 65. All of the named executive officers who participate in the NQDC Plan, other than Mr. Pease, have completed at least five years of service and are 100% vested in their respective employer contributions.
NQDC Plan account balances are payable in the form of either a lump sum or a series of annual installments (not to exceed 10 years) beginning on an applicable distribution date (which may include a separation from service, death, disability or a change in control event), in each case as elected by the participant. Any portion of an NQDC Plan account balance that is unvested as of the applicable distribution date will be automatically forfeited.
The following table provides information regarding Ashtead’s non-tax qualified defined contribution and deferred compensation plans for each of our named executive officers for the fiscal year ended April 30, 2025 (other than Mr. Pratt, who does not participate in such plans).
| Name(a) |
Executive Contributions in Last Fiscal Year ($) (b) |
Registrant Contributions in Last Fiscal Year ($) (c)(1) |
Aggregate Earnings in Last Fiscal Year ($) (d) |
Aggregate Withdrawals/Distributions ($) (e) |
Aggregate Balance at Last Fiscal Year End ($) (f) |
|||||||||||||||
| Brendan Horgan |
||||||||||||||||||||
| Deferred Cash Compensation |
30,673 | 30,673 | 105,691 | — | 1,351,984 | |||||||||||||||
| Alex Pease |
||||||||||||||||||||
| Deferred Cash Compensation |
41,231 | 41,231 | (4,367 | ) | — | 78,095 | ||||||||||||||
| John Washburn |
||||||||||||||||||||
| Deferred Cash Compensation |
54,673 | 30,673 | 100,498 | — | 1,298,527 | |||||||||||||||
| Rod Samples |
||||||||||||||||||||
| Deferred Cash Compensation |
75,434 | 34,100 | (17,300 | ) | — | 1,266,614 | ||||||||||||||
| Deferred Equity Compensation(2) |
— | 413,737 | (76,729 | ) | — | 337,009 | ||||||||||||||
| Brad Lull |
||||||||||||||||||||
| Deferred Cash Compensation |
66,227 | 30,500 | 81,936 | — | 1,054,194 | |||||||||||||||
| (1) | The amount reported in this column with respect to deferred cash compensation is included in the “All Other Compensation” column of the Summary Compensation Table. |
| (2) | The amount reported in the “Executive Contributions in Last Fiscal Year” column is attributable to the value of 6,324 deferred Ashtead Shares underlying awards that vested on July 5, 2024, multiplied by the closing market price of a share of Ashtead common stock as of July 5, 2024 (£51.12) converted into U.S. dollars at an exchange rate of $1.2798 per £1.00. All earnings shown are attributable to the change in the market price of a share of Ashtead common stock as measured on April 30, 2025. No amounts shown were reported in the Summary Compensation Table for the fiscal year ended April 30, 2025. |
2025 Potential Payments upon Termination or Change in Control
This section describes the payments and benefits the named executive officers would have received in connection with certain employment termination scenarios or upon a change of control during the fiscal year ended April 30, 2025.
107
Table of Contents
Employment Agreements
Messrs. Horgan, Pease, Washburn, Samples and Lull. Messrs. Horgan, Pease, Washburn, Samples and Lull are each party to an employment agreement with Sunbelt Rentals, Inc. Under the employment agreements, in the event of a termination of the applicable named executive officer’s employment by Sunbelt Rentals, Inc. without “cause” (as defined in the applicable employment agreement) or, solely with respect to Mr. Pease, by Mr. Pease for “good reason” (as defined in his employment agreement), subject to the applicable named executive officer’s compliance with the restrictive covenants set forth in his employment agreement and entry into an effective general release of claims, the applicable named executive officer would receive (i) 12 months’ base salary continuation, payable in substantially equal installments, and (ii) a lump sum cash payment equal to the pro-rated performance bonus for the year of termination based on actual achievement of performance goals (in the case of Messrs. Horgan, Washburn, Samples and Lull, only if the bonus criteria were determined by the Ashtead Remuneration Committee and communicated in writing to the applicable named executive officer prior to such termination). In the event that the applicable named executive officer resigns, the named executive officer must provide Sunbelt Rentals, Inc. with 12 months’ notice of his intention to resign from employment, provided that Sunbelt Rentals, Inc. may accelerate the timing of his termination to an earlier date by providing him with 12 months’ base salary continuation, payable in substantially equal installments, subject to his compliance with the restrictive covenants set forth in his employment agreement. The employment agreements do not provide for enhanced severance benefits in the event of a qualifying termination in connection with a change in control.
Mr. Pratt. Mr. Pratt is party to a service agreement with Ashtead. In the event that either party seeks to terminate Mr. Pratt’s employment, the terminating party must provide the other party with 12 months’ notice, provided that Ashtead may accelerate the timing of his termination to an earlier date by providing him with a lump sum payment of 12 months’ base salary (or, if lower, base salary for the remainder of the unexpired notice period). In connection with Mr. Pratt’s retirement from serving as Chief Financial Officer, Ashtead and Mr. Pratt entered into the Pratt Letter Agreement formalizing that there would be a 12-month notice period that commenced on September 2, 2024 and specifying that, during the notice period and subject to his provision of assistance in connection with the transition of his role, Mr. Pratt would remain entitled to receive his existing base salary and benefits and a full 2025 annual bonus without pro-ration (but no bonus for the fiscal year ending April 30, 2026). In addition, subject to the Ashtead Remuneration Committee determining “good leaver” status for Mr. Pratt at the end of the notice period, a pro-rated portion of any then-outstanding unvested equity awards and DBP awards will be eligible to vest in accordance with the LTIP and DBP, respectively (as described below).
Treatment of Incentive Compensation
Treatment of RSUs and PSUs under the LTIP and annual bonuses and DBP awards under the DBP, in each case upon a participant’s termination of employment, differs depending on the nature of the participant’s termination of employment. For purposes of the LTIP and the DBP, a “good leaver” is a participant who ceases to be an employee by reason of:
| • | ill-health, injury or disability; |
| • | the participant’s employing company ceasing to be under the control of Ashtead; |
| • | a transfer or undertaking, or the part of the undertaking, in which the participant works to a person which is not under the control of Ashtead or its subsidiaries; |
| • | any other circumstances determined by the Ashtead Remuneration Committee; or |
| • | for purposes of the DBP only, (i) redundancy within the meaning of the Employment Rights Act 1996 or equivalent legislation or (ii) retirement by agreement with the participant’s employing company. |
If a participant is a good leaver, then (a) for purposes of the DBP, (i) the participant would receive an annual bonus for the year of termination based on time pro-ration (unless otherwise determined by the Ashtead
108
Table of Contents
Remuneration Committee) and actual performance and (ii) the participant’s unvested DBP awards would accelerate in vesting or continue to vest (as determined by the Ashtead Remuneration Committee), subject to time pro-ration (unless otherwise determined by the Ashtead Remuneration Committee), and (b) for purposes of the LTIP, the participant’s RSUs and PSUs would accelerate in vesting or continue to vest (as determined by the Ashtead Remuneration Committee), subject to time pro-ration (unless otherwise determined by the Ashtead Remuneration Committee), actual performance and such other factors as the Ashtead Remuneration Committee may consider relevant.
If a participant incurs a termination of employment due to death, then (a) for purposes of the DBP, the participant will be treated as a “good leaver” as set out above and (b) for purposes of the LTIP, a pro-rated portion of the participant’s unvested RSUs and PSUs would accelerate in vesting, subject to time pro-rating (unless otherwise determined by the Ashtead Remuneration Committee), actual performance and such other factors as the Ashtead Remuneration Committee may consider relevant.
If a participant incurs a termination of employment other than due to good leaver circumstances or death (the participant is a “bad leaver”), the participant’s respective annual bonus, unvested RSUs, unvested PSUs and unvested DBP awards would be immediately forfeited for no consideration.
If there were a takeover of Ashtead (within the meaning of the DBP and LTIP), then, unless outstanding awards under the DBP and the LTIP are exchanged for substantially equivalent awards of the acquiring company, (a) unvested DBP awards will vest immediately and the Ashtead Remuneration Committee will calculate the amount to be paid (including any pro-rata reduction) and (b) unvested RSUs and unvested PSUs will vest upon the effective date of the takeover subject to time pro-ration (unless otherwise determined by the Ashtead Remuneration Committee), actual performance and such other factors as the Ashtead Remuneration Committee may consider relevant.
Estimated values in the table below assume a termination of employment on April 30, 2025 and are calculated based on the closing stock price of an Ashtead Share as of such date (£39.90) converted to U.S. dollars $1.3356 per £1.00, which represents a spot exchange rate on April 30, 2025 of $1.3356 per £1.00. For a description of the treatment of account balances under the NQDC Plan, see “—2025 Nonqualified Deferred Compensation” above.
| Name |
Death (1) | Good Leaver (1)(2) |
Change in Control (DBP and LTIP Awards not Assumed) |
|||||||||
| Brendan Horgan |
||||||||||||
| Cash Severance |
— | 1,169,750 | — | |||||||||
| Pro Rata Bonus |
1,754,625 | 1,754,625 | — | |||||||||
| Accelerated Vesting of RSUs |
186,486 | 186,486 | 186,486 | |||||||||
| Accelerated Vesting of PSUs |
5,268,862 | 5,268,862 | 5,268,862 | |||||||||
| Accelerated Vesting of DBP Awards (3) |
— | — | — | |||||||||
| Total |
7,209,972 | 8,379,722 | 5,455,347 | |||||||||
| Alex Pease |
||||||||||||
| Cash Severance |
— | 850,000 | — | |||||||||
| Pro Rata Bonus |
823,219 | 823,219 | — | |||||||||
| Accelerated Vesting of RSUs |
50,065 | 50,065 | 50,065 | |||||||||
| Accelerated Vesting of PSUs |
260,255 | 260,255 | 260,255 | |||||||||
| Accelerated Vesting of DBP Awards (3) |
— | — | — | |||||||||
| Accelerated Vesting of NQDC Plan Employer Contributions (4) |
41,231 | 41,231 | 41,231 | |||||||||
| Total |
1,174,770 | 2,024,770 | 351,551 | |||||||||
109
Table of Contents
| Name |
Death (1) | Good Leaver (1)(2) |
Change in Control (DBP and LTIP Awards not Assumed) |
|||||||||
| John Washburn |
||||||||||||
| Cash Severance |
— | 502,400 | — | |||||||||
| Pro Rata Bonus |
753,600 | 753,600 | — | |||||||||
| Accelerated Vesting of RSUs |
83,528 | 83,528 | 83,528 | |||||||||
| Accelerated Vesting of PSUs |
972,820 | 972,820 | 972,820 | |||||||||
| Accelerated Vesting of DBP Awards (3) |
— | — | — | |||||||||
| Total |
1,809,948 | 2,312,348 | 1,056,348 | |||||||||
| Rod Samples |
||||||||||||
| Cash Severance |
— | 494,000 | — | |||||||||
| Pro Rata Bonus |
741,000 | 741,000 | — | |||||||||
| Accelerated Vesting of RSUs |
82,138 | 82,138 | 82,138 | |||||||||
| Accelerated Vesting of PSUs |
1,080,634 | 1,080,634 | 1,080,634 | |||||||||
| Accelerated Vesting of DBP Awards (3) |
— | — | — | |||||||||
| Total |
1,903,772 | 2,397,772 | 1,162,772 | |||||||||
| Brad Lull |
||||||||||||
| Cash Severance |
— | 452,400 | — | |||||||||
| Pro Rata Bonus |
678,600 | 678,600 | — | |||||||||
| Accelerated Vesting of RSUs |
75,215 | 75,215 | 75,215 | |||||||||
| Accelerated Vesting of PSUs |
989,624 | 989,624 | 989,624 | |||||||||
| Accelerated Vesting of DBP Awards (3) |
— | — | — | |||||||||
| Total |
1,743,439 | 2,195,839 | 1,064,839 | |||||||||
| (1) | For purposes of this table, amounts set forth with respect to pro rata bonus and accelerated vesting of PSUs assume maximum achievement of performance goals (other than with respect to PSUs for which the applicable three-year performance period concluded as of April 30, 2025, which are instead based on actual achievement of applicable performance goals). |
| (2) | For purposes of this table, “Good Leaver” refers to (a) for purposes of cash severance, a termination of the applicable named executive officer’s employment without “cause” or, solely with respect to Mr. Pease, by Mr. Pease for “good reason” (each within the meaning of the applicable employment agreement), (b) for purposes of all other items, (i) “good leaver” within the meaning of the DBP or the LTIP, as applicable, or (ii) with respect to accelerated vesting of NQDC Plan employer contributions for Mr. Pease, Mr. Pease’s death or “disability” (within the meaning of the NQDC Plan). |
| (3) | As a result of the assumed termination of employment date of April 30, 2025 and vesting dates for DBP Awards occurring on April 30 of each year, pro-rated accelerated vesting of DBP awards for purposes of this table would be equal to zero. |
| (4) | As described in “—2025 Nonqualified Deferred Compensation” above, Mr. Pease is the only named executive officer who participates in the NQDC Plan who has not completed at least five years of service as of April 30, 2025, such that his employer contributions would be 100% vested on such date. As of April 30, 2025, Mr. Pease had completed less than one year of service; therefore, the full amount of the employer contributions under his NQDC Plan account balance were unvested at such time and would accelerate in vesting upon the occurrence of one of the events set forth above. |
Other than as described and set forth in the table above, there is no enhanced termination treatment or severance benefits in the event of a qualifying termination in connection with a change in control. Although Mr. Pratt remained employed on April 30, 2025, Mr. Pratt is not included in the table above as a result of the Pratt Letter Agreement that specifies the terms of his compensation and potential severance amounts if he remains employed through the remainder of his notice period (as described above).
110
Table of Contents
2025 Director Compensation
In the fiscal year ended April 30, 2025, our non-employee directors were eligible to receive the following cash retainers, paid monthly in arrears:
| Annual Retainer for Board Membership |
Annual Retainer (1) |
|||
| Annual service as chair |
$ | 608,618 | ||
| Annual service on the board of directors |
$ | 115,317 | ||
| Annual retainer senior independent director |
$ | 32,033 | ||
| Additional Annual Retainer for Committee Membership |
||||
| Annual service as chair of the audit committee |
$ | 32,033 | ||
| Annual service as chair of the remuneration committee |
$ | 32,033 | ||
| Annual service as chair of the nomination committee |
$ | 32,033 | ||
| Annual service as chair of the finance and administration committee |
$ | 32,033 | ||
| (1) | Paid in British pounds and presented in U.S. dollars at an exchange rate of $1.2813 per £1.00, which represents Ashtead’s average exchange rate for fiscal year 2025. |
In addition, we reimburse all reasonable out-of-pocket expenses incurred by non-employee directors in carrying out their duties as a director (including any tax arising thereon) and other modest benefits as appropriate.
The following table presents the total compensation paid, awarded or earned with respect to each person who served as a non-employee director in the fiscal year ended April 30, 2025. As of April 30, 2025, none of the non-employee directors held outstanding unvested stock awards or outstanding unexercised option awards. Messrs. Horgan, Pease and Pratt, who are each named executive officers, did not receive additional compensation for their respective services as a director.
| Name |
Fees Earned or Paid in Cash ($) (1) |
All Other Compensation ($) |
Total ($) | |||||||||
| Paul Walker |
608,618 | — | 608,618 | |||||||||
| Angus Cockburn |
179,382 | — | 179,382 | |||||||||
| Jill Easterbrook |
115,317 | — | 115,317 | |||||||||
| Tanya Fratto |
115,317 | — | 115,317 | |||||||||
| Renata Ribeiro |
115,317 | — | 115,317 | |||||||||
| Lucinda Riches |
147,350 | — | 147,350 | |||||||||
| Roy Twite (2) |
102,750 | — | 102,750 | |||||||||
| Lindsley Ruth (3) |
48,049 | — | 48,049 | |||||||||
| (1) | Paid in British pounds and presented in U.S. dollars at an exchange rate of $1.2813 per £1.00, which represents Ashtead’s average exchange rate for fiscal year 2025. |
| (2) | Mr. Twite was appointed to the Ashtead Board of Directors in June 2024. |
| (3) | Mr. Ruth stepped down from the Ashtead Board of Directors in September 2024. |
Post-Listing Compensation Arrangements
This section discusses certain compensation arrangements that are expected to apply to named executive officers and directors of Sunbelt Rentals after the effectiveness of the U.S. Listing.
Amended and Restated Employment Agreements
We entered into amended and restated employment agreements with each of the named executive officers (other than Messrs. Pratt and Samples), effective as of the U.S Listing, that are substantially similar in all
111
Table of Contents
respects to such named executive officers’ existing employment agreements, other than certain modifications with respect to severance payable upon a qualifying termination of employment. This summary is qualified in its entirety by reference to, and should be read together with, the full text of the amended and restated employment agreements for each of the named executive officers (other than Messrs. Pratt and Samples), which are attached hereto as Exhibits 10.15, 10.16, 10.17 and 10.18.
Non-Employee Director Compensation Policy
We adopted a compensation policy for our non-employee directors, effective as of the U.S. Listing, that consists of annual retainer fees and long-term equity awards.
Pursuant to this policy, each eligible non-employee director will receive an annual cash retainer of $120,000. The Chair of the Sunbelt Rentals Board will receive an additional annual cash retainer of $450,000, the Chair of the Audit Committee will receive an additional annual cash retainer of $25,000, the Chair of the Compensation Committee will receive an additional annual cash retainer of $25,000 and the Chair of the Nominating and Corporate Governance Committee will receive an additional annual cash retainer of $25,000. Each annual cash retainer will be paid quarterly in arrears.
Also, pursuant to this policy, on the date of any annual meeting of our stockholders, we intend to grant each eligible non-employee director an award of restricted stock units with a grant date fair value of $175,000. The terms of each such award will be set forth in a written award agreement, which will provide for vesting on the earlier of the day immediately preceding the subsequent annual meeting of our stockholders and the first anniversary of the grant date, subject to the applicable non-employee director continuing in service through such vesting date.
In addition, we intend to grant each non-employee director who serves on the Sunbelt Rentals Board as of the effectiveness of the U.S. Listing, on the first date of effectiveness of Sunbelt Rentals’ first registration statement on Form S-8 with respect to the 2026 Plan (as defined under “—Sunbelt Rentals 2026 Omnibus Equity Incentive Plan” below), a prorated award of restricted stock units with a grant date fair value of $175,000 based on the number of days between the effectiveness of the U.S. Listing and the anticipated date the 2026 annual meeting of our stockholders divided by 365.
Non-employee directors who are appointed after the effectiveness of the U.S. Listing and prior to the date of the first annual meeting or between annual meetings will receive prorated awards of restricted stock units.
Each of the foregoing restricted stock unit awards held by a non-employee director will vest in full immediately prior to the occurrence of a change in control (as defined in the 2026 Plan), to the extent outstanding at such time. All restricted stock unit awards granted under this policy will be granted under, and subject to the limits of, the 2026 Plan and an award agreement thereunder.
We intend to allow non-employee directors to defer settlement of shares underlying certain of their restricted stock unit awards.
This summary is qualified in its entirety by reference to, and should be read together with, the full text of the policy, which is attached hereto as Exhibit 10.21.
Ashtead Group plc 2017 Deferred Bonus Plan
Upon the Scheme Effective Date, outstanding DBP Awards shall remain in effect, provided that the DBP Awards shall instead track the value of a Sunbelt Rentals share rather than the value of an Ashtead Share.
112
Table of Contents
The Ashtead Group Long-Term Incentive Plan 2021
Sunbelt Rentals will, upon the Scheme Effective Date, assume the LTIP and the awards thereunder, with the terms of such awards (including the vesting schedule and any vesting conditions) to remain the same, except that, effective as of and contingent upon the effectiveness of the U.S. Listing, and as part of bringing the Group’s approach to the amount and structure of its compensation of senior management following the U.S. Listing into line with U.S. market practice for U.S. listed companies of a similar size and profile, (i) any holding periods which apply to outstanding awards will no longer apply, (ii) any underpins which apply to outstanding RSUs will no longer apply and (iii) the performance-vesting conditions which apply to outstanding PSUs will, subject to consent by the applicable award holder, no longer apply and instead be deemed to have been met at 85.5% of maximum, which broadly aligns with the average historical performance-vesting achievement level of PSUs over the five most recently-completed fiscal years. The Compensation Committee considered various factors in determining how to most appropriately address outstanding LTIP awards upon the effectiveness of the U.S. Listing given the significant accounting transition and complexities associated with retesting performance criteria. Considerations included maintaining retention elements of the current LTIP, providing a consistent and transparent approach for executives and shareholders and further positioning the management team and Sunbelt Rentals for its transition to the U.S. The Compensation Committee believes that the approach and calculated performance-vesting achievement level of 85.5% for outstanding PSUs balances these goals while recognizing historical performance.
On and after the effectiveness of the U.S. Listing and following the effectiveness of the 2026 Plan (as described below), no further grants will be made under the LTIP.
Sunbelt Rentals 2026 Omnibus Equity Incentive Plan
Sunbelt Rentals adopted the Sunbelt Rentals 2026 Omnibus Equity Incentive Plan (the 2026 Plan) to be effective upon the effectiveness of the U.S. Listing. The material terms of the 2026 Plan are summarized below. The summary does not contain all information about the 2026 Plan. This summary is qualified in its entirety by reference to, and should be read together with, the full text of the 2026 Plan, which is attached hereto as Exhibit 10.19.
The purpose of the 2026 Plan is to provide Sunbelt Rentals with flexibility in its ability to motivate, attract and retain the services of directors, officers, employees and consultants, upon whose judgment, interests and special effort the successful conduct of Sunbelt Rental’s operation is largely dependent, through the granting of stock-based compensation awards, including, without limitation, nonqualified stock options (NQSOs), incentive stock options (ISOs), stock appreciation rights (SARs), restricted shares, RSUs, cash incentive awards and other equity-based or equity-related awards. The principal features of the 2026 Plan are summarized below.
Share Reserve and Usage
Subject to adjustment as described below, the maximum number of shares (as described below) reserved for issuance pursuant to the awards is equal to the sum of (i) 18,200,000 (inclusive of any awards made pursuant to any sub-plan of the 2026 Plan) and (ii) any shares that are subject to awards under the LTIP that are forfeited or lapse unexercised following the effective date of the 2026 Plan (the Share Limit). The maximum number of shares that may be delivered upon the exercise of ISOs will be equal to 18,200,000 (the ISO Limit). The shares covered by the 2026 Plan may be authorized but unissued shares, treasury shares or shares reacquired by Sunbelt Rentals in any manner or any combination of the foregoing.
The following counting provisions will be in effect for the share reserve under the 2026 Plan:
| • | if an award granted under the 2026 Plan is forfeited, or otherwise expires, terminates or is cancelled without the issuance of all shares subject to the award, or if such an award (including any corresponding dividends or dividend equivalents) is settled (in whole or in part) for cash, the number of shares subject to the award that were not issued will not be treated as delivered and will not reduce the Share Limit; |
113
Table of Contents
| • | if shares are surrendered or tendered in payment of the exercise price of an option or to satisfy any tax withholding obligation with respect to any award, such shares will not be added back to the remaining Share Limit; |
| • | if shares subject to an SAR are not issued in connection with the share settlement of the SAR on exercise thereof, such shares will not be added back to the remaining Share Limit; and |
| • | if shares are purchased on the open market by Sunbelt Rentals or otherwise with the cash proceeds received from the exercise of options, such shares will not be added back to the remaining Share Limit. |
Subject to restrictions on repricing of options and SARs described below, the Compensation Committee may grant awards in assumption of, or in substitution for, outstanding awards previously granted by Sunbelt Rentals, its affiliates or a company acquired by, or that combines with, Sunbelt Rentals or its affiliates (Substitute Awards). Any shares underlying any Substitute Awards will not count against the shares available for issuance under the 2026 Plan, except that any Substitute Awards issued or intended as ISOs will be counted against the ISO Limit.
The sum of the grant date fair value of equity-based awards and the amount of any cash compensation granted or paid, as applicable, to a non-employee director in any fiscal year will not exceed (i) $2,200,000, in the case of any non-employee director who also serves as the chairperson of the Sunbelt Rentals Board and (ii) $1,000,000, in the case of any other non-employee director.
Administration
The Compensation Committee (or a subcommittee thereof or such other committee of the Sunbelt Rentals Board as may be designated by the Sunbelt Rentals Board) will administer the 2026 Plan and any sub-plans. The Sunbelt Rentals Board may, in its discretion, administer the 2026 Plan or any sub-plan with respect to awards granted to non-employee directors. The 2026 Plan provides that the Compensation Committee may from time to time delegate (i) its authority to grant awards or (ii) the authority (including a power to sub-delegate) to perform specified functions under the 2026 Plan to one or more members of the Sunbelt Rentals Board or one or more officers or employees of Sunbelt Rentals or an affiliate, provided that no officer will be delegated such authority to grant awards to individuals who are subject to Section 16 of the Exchange Act or to officers or directors who have been delegated the authority to grant or amend awards under the 2026 Plan.
Subject to the terms and conditions of the 2026 Plan and applicable law, the Compensation Committee will have the authority to (i) select the eligible directors, officers, employees and consultants to whom awards are to be made, (ii) determine the terms and conditions of awards, (iii) interpret, administer, reconcile any inconsistency in, correct any default in and supply any omission in, the 2026 Plan and any instrument or agreement relating to, or award made under, the 2026 Plan, (iv) establish, amend, suspend or waive such rules and regulations and appoint such agents as it deems appropriate for the proper administration of the 2026 Plan, (v) accelerate vesting, exercisability of, payment for or lapse restrictions on awards and (vi) make all other determinations and take all other actions necessary or advisable for the administration of the 2026 Plan.
Eligibility
The 2026 Plan provides that awards may be granted to any director, officer, employee or consultant of Sunbelt Rentals or any of its subsidiaries (including any prospective director, officer, employee or consultant to the extent permitted in accordance with Form S-8 under the Exchange Act). The Compensation Committee determines which of such directors, officers, employees and consultants will be granted awards. No person is entitled to participate in the 2026 Plan as a matter of right. Only those directors, officers, employees and consultants who are selected to receive grants by the Compensation Committee may participate in the 2026 Plan.
114
Table of Contents
Awards
The 2026 Plan provides that the Compensation Committee may grant or issue stock options (including ISOs), SARs, restricted shares, RSUs, cash incentive awards and other equity-based or equity-related awards, or any combination thereof. Each award will be set forth in a separate agreement with the person receiving the award and will indicate the type, terms and conditions of the award, including the exercise price, vesting schedule and treatment of awards upon termination of employment, if applicable. Vesting provisions require certain conditions to be met, such as continued employment or specified performance goals, before a participant may receive the shares underlying an award or before such shares become freely tradeable and nonforfeitable.
Stock Options and SARs. A stock option is an award that represents the right to purchase shares at a specified price (the exercise price) in accordance with the terms of the award agreement. Stock options will be either NQSOs or ISOs. A SAR is an award that represents a promise to deliver shares, cash, other securities, other awards or other property equal in value to the excess, if any, of the fair market value per share over the exercise price per share of the SAR in accordance with the terms of the award agreement.
The exercise price per share subject to each option and SAR shall be set by the Compensation Committee. Subject to the adjustment of awards described below, in no event may any option or SAR (i) be amended to decrease the exercise price thereof, (ii) be canceled at a time when its exercise price exceeds the fair market value of the underlying shares in exchange for another award under the 2026 Plan or any other equity compensation plan or any cash payment or (iii) be subject to any action that would be treated, for accounting purposes, as a “repricing” of such option or SAR, unless such amendment, cancellation or action is approved by Sunbelt Rentals’ stockholders.
Options and SARs usually will become exercisable (at the discretion of the Compensation Committee) in one or more installments after the grant date, subject to the participant’s continued employment or service with Sunbelt Rentals or one of its affiliates and/or subject to the satisfaction of corporate performance targets and individual performance targets established by the Compensation Committee. Except as otherwise specified in the applicable award agreement, each option or SAR generally expires immediately, without any payment therefor, upon the earlier of (i) the tenth anniversary of the date the option or SAR is granted and (ii) a date that is three months after the date the participant ceases to be a director, officer, employee or consultant of Sunbelt Rentals or one of its affiliates.
ISOs will be designed in a manner intended to comply with the provisions of Sections 421 and 422 of the Internal Revenue Code and will be subject to specified restrictions contained in the Internal Revenue Code. Among such restrictions, ISOs will have an exercise price of not less than the fair market value of a share on the date of grant. ISOs will only be granted to employees and will not be exercisable after a period of ten (10) years measured from the date of grant. In the case of an ISO granted to an individual who owns (or is deemed to own) more than ten percent (10%) of the total combined voting power of all classes of Sunbelt Rentals’ capital stock, the exercise price per share must be at least 110% of the fair market value of a share on the date of grant and the ISO must not be exercisable after a period of five (5) years measured from the date of the grant.
Each option or SAR may only be exercised to the extent that it has vested at the time of exercise, except as otherwise specified in the applicable award agreement. Each option will be deemed to be exercised when notice of such exercise has been given to Sunbelt Rentals in accordance with the terms of the applicable award agreement and full payment of the exercise price for the shares with respect to which the option is exercised has been received by Sunbelt Rentals and the participant has paid to Sunbelt Rentals an amount equal to any federal, state, local and non-U.S. income, employment and any other applicable taxes required to be withheld. Such payments may be made in cash or through any other method (or combination of methods) approved by the Compensation Committee.
115
Table of Contents
Dividends and dividend equivalents may be paid with respect to options or SARs held by non-U.S. taxpayers, but not U.S. taxpayers. Any such dividends or dividend equivalents will be accumulated in a manner determined by the Compensation Committee and will only be paid out to the extent that the option or SAR vests (without prejudice to the right of the Compensation Committee to determine that dividends or dividend equivalents may be provided for in respect of any period that may elapse between the shares subject to the option being earned (in whole or in part) and the delivery to the participant of the resulting shares, cash, other securities, other awards or other property).
Restricted Shares and RSUs. A restricted share is a share that is subject to certain transfer restrictions, forfeiture provisions and other terms and conditions specified in the applicable award agreement. An RSU is an award that represents a promise to deliver shares, cash, other securities or other property in accordance with the terms of the applicable award agreement.
Restricted shares and RSUs may be granted to any eligible individual selected by the Compensation Committee and will be made subject to such restrictions or vesting conditions as may be determined by the Compensation Committee. Restricted shares, typically, will be forfeited for no consideration or repurchased by Sunbelt Rentals at the original purchase price or such other amount as may be specified in the award agreement if the conditions or restrictions on vesting are not met. The 2026 Plan provides that restricted shares generally may not be sold or otherwise transferred until restrictions are removed or expire.
Except as provided in the applicable award agreement, recipients of restricted shares will have rights of a stockholder (including voting rights) prior to the time when the restrictions lapse. Unlike restricted shares, recipients of RSUs generally will not have any rights as a stockholder with respect to any shares to be distributed under the 2026 Plan until the participant or beneficiary, as applicable, has become the holder of such shares.
Any dividends or dividend equivalents that may be payable with respect to the restricted shares and RSUs will be accumulated in a manner determined by the Compensation Committee and will only be paid out to the extent that the restricted shares or RSUs vest (without prejudice to the right of the Compensation Committee to determine that dividends or dividend equivalents may be provided for in respect of any period that may elapse between a restricted share or RSU being earned (in whole or in part) and the delivery to the participant of the resulting shares, cash, other securities, other awards or other property).
Cash Incentive Awards and Other Equity-Based or Equity-Related Awards. The Compensation Committee may grant cash incentive awards and other equity-based or equity-related awards (whether payable in cash, equity or otherwise), including fully vested shares, in such amount and subject to such terms and conditions as the Compensation Committee determines.
Change in Control
In the event that a change in control of Sunbelt Rentals occurs and the surviving entity or successor corporation in such change in control does not assume or substitute outstanding awards (or any portion thereof) granted under the 2026 Plan, then, unless the Compensation Committee determines otherwise, such awards will fully vest and become fully exercisable, as applicable, as of immediately prior to such change in control, with performance-based awards vesting at either target level, which may be pro-rated, or actual achievement, as determined by the Compensation Committee. In addition, the Compensation Committee may, in its sole discretion, upon or in anticipation of a change in control, terminate outstanding awards after giving the participant an opportunity to exercise the awards or terminate the awards for no consideration if the awards have no value (as determined by the Compensation Committee in its sole discretion).
116
Table of Contents
Adjustments of Awards
In the event of any extraordinary dividend, extraordinary distribution, recapitalization, rights offering, share split, reverse share split, split-up or spin-off, the 2026 Plan provides that the Compensation Committee will make equitable adjustments as the Compensation Committee determines appropriate, to reflect such change with respect to:
| • | the number of shares or other securities (or number and kind of other securities or property) with respect to which awards may be granted under the 2026 Plan, including the Share Limit and the ISO Limit; and |
| • | the terms of any outstanding awards so as to prevent the enlargement or diminishment of the benefits provided thereunder, including the number of shares subject to the award, the exercise price, if any, and vesting terms (including performance goals). |
In the event of any reorganization, merger, consolidation, combination, repurchase or exchange of shares or other securities of Sunbelt Rentals, issuance of warrants or other rights to purchase shares or other securities of Sunbelt Rentals or other similar corporate transaction or event or other unusual, extraordinarily or non-recurring event, the 2026 Plan provides that the Compensation Committee may make any equitable adjustment described under the preceding paragraph and may also provide that (i) outstanding awards will be cancelled in exchange for a cash payment (or no payment in the case of out-of-the-money options and SARs) and (ii) options and SARs will expire if not exercised prior to a specified date.
Amendment and Termination
The 2026 Plan provides that, subject to applicable law, the Sunbelt Rentals Board may amend, modify or terminate the 2026 Plan at any time; except that no amendment or termination may, without the consent of the affected participant, materially and adversely affect any rights of such participant with respect to a previously granted award unless otherwise provided in the applicable award agreement.
The 2026 Plan will generally require Sunbelt Rentals to obtain stockholder approval for any amendment that would (other than in connection with certain corporate events, as described above):
| • | increase the Share Limit and ISO Limit under the 2026 Plan; |
| • | expand the class of employees or other individuals eligible to participate in the 2026 Plan; |
| • | extend the expiration date of the 2026 Plan; and |
| • | allow for the repricing of options or SARs. |
The 2026 Plan provides that the Compensation Committee may waive any conditions or rights under, amend any terms or alter, suspend, discontinue, cancel or terminate any outstanding award, prospectively or retrospectively, except that, unless otherwise provided in the 2026 Plan or applicable award agreement, any such action that would materially and adversely impair the rights of any participant or beneficiary will not be effective without the consent of the applicable participant or beneficiary.
Expiration Date
The 2026 Plan will expire on, and no award will be granted pursuant to the 2026 Plan after, the tenth anniversary of the date prior to the date of the U.S. Listing; provided that the 2026 Plan will remain in effect past such date solely for the purposes of administering previously granted awards that remain outstanding. Any award outstanding on the expiration date of the 2026 Plan will remain in force according to the terms of the 2026 Plan and the applicable award agreement.
117
Table of Contents
Item 7. Certain Relationships and Related Transactions, and Director Independence.
Transactions with Related Parties
The following is a description of transactions or series of transactions since May 1, 2022, to which we were or will be a party, in which:
| • | the amount involved in the transaction exceeds, or will exceed, the lesser of $120,000 or 1% of the average of the Company’s total assets for the last two completed fiscal years; and |
| • | any of our executive officers, directors or holder of 5% or more of any class of our capital stock, including their immediate family members or affiliated entities, had or will have a direct or indirect material interest. |
Employment Agreements
We have entered into employment agreements with our named executive officers. See Item 6 (Executive Compensation) for further information on our director and named executive officer compensation arrangements.
Kyle Horgan, our Executive Vice President, Specialty, is the brother of Brendan Horgan, our Chief Executive Officer. He has been an employee of the Group since July 1998. In consideration of services, Mr. Horgan received total cash compensation for the fiscal year ended April 30, 2023 of approximately $690,863, including a base salary of $345,208 and bonuses of approximately $345,655. His total cash compensation for the fiscal year ended April 30, 2024 was approximately $608,988, including a base salary of $416,000 and bonuses of approximately $192,988. His total cash compensation for the fiscal year ended April 30, 2025 was approximately $794,864, including a base salary of $416,000 and bonuses of approximately $378,864. In addition, Mr. Horgan received vested equity award proceeds under the LTIP corresponding to a value of $304,311, $627,544 and $1,495,185, in the fiscal years ended April 30, 2023, 2024 and 2025, respectively. He also received benefits generally available to all employees with similar responsibilities and positions, including medical insurance, life cover, car allowance and travel and accommodation allowances. We expect that total compensation for Mr. Horgan, including salary and bonuses, will exceed $120,000 in the fiscal year ending April 30, 2026. Mr. Horgan’s compensation is determined in accordance with our standard employment and compensation practices applicable to employees with similar responsibilities and positions.
Related Party Transaction Approval Policy
Our board of directors has updated our policy for the review, approval or ratification of “related party” transactions. Under the policy, a “related party” includes our directors, director nominees, executive officers and greater than 5% shareholders, and any of their immediate family members, and a “related party transaction” includes one in which (1) the total amount may exceed $120,000, (2) the Company is a participant, and (3) a related party will have a direct or indirect material interest.
The policy provides that, where a related party transaction could result in a conflict of interest, it will be reviewed and approved by our Audit Committee. Only those related party transactions that are fair, reasonable, and consistent with the policy will be finally approved. In making this determination, all available and relevant facts and circumstances will be considered, including the benefits to us, the impact of the transaction on the related party’s independence, the terms of the transaction, the extent of the related party’s interest in the transaction, the controls implemented by us and the terms available from unrelated third parties.
Director Independence
Following the effectiveness of this Registration Statement, the Sunbelt Rentals Common Stock will be listed on the NYSE. Our board of directors has determined that Paul Walker, Nando Cesarone, Angus Cockburn, Jill Easterbrook, Renata Ribeiro, James Singleton and Roy Twite are considered “independent” directors within the
118
Table of Contents
meaning of the rules of the NYSE for listed companies. Each member of our Audit Committee is independent under applicable NYSE listing standards and meets the standards for independence required by U.S. securities law requirements applicable to public companies, including Rule 10A-3 of the Exchange Act.
Refer to “Legal Proceedings” under Item 1 (Business) for a discussion of the legal proceedings, other than ordinary routine litigation incidental to the business, to which we or any of our subsidiaries are a party or of which any of our or their property is the subject.
Item 9. Market Price of and Dividends on the Registrant’s Common Equity and Related Stockholder Matters.
Market Information; Holders
There is currently no public market in the United States for the Sunbelt Rentals Common Stock. We intend to seek the listing of the Sunbelt Rentals Common Stock on the NYSE as soon as practicable after this Registration Statement becomes effective. See Item 11 (Description of Registrant’s Securities to be Registered).
As of January 16, 2026, we estimate that there were approximately 2,366 Ashtead Shareholders.
Dividends and Share Repurchases
During the fiscal year ended April 30, 2025, our returns to shareholders amounted to $886 million, including dividends paid of $544 million ($1.25 per share, compared to $1.01 and $0.83 in the fiscal years ended April 30, 2024 and 2023, respectively) and share repurchases of $342 million.
We deploy a progressive dividend policy and intend to pay regular quarterly dividends for the foreseeable future. Any decision to declare and pay dividends will be made at the discretion of our board of directors and will depend on, among other things, our results of operations, liquidity requirements, financial condition, contractual restrictions and other factors that our board of directors may deem relevant.
In addition, our ability to pay dividends is limited by covenants contained in our credit facility and in the indenture governing our Senior Notes. Future agreements may also limit our ability to pay dividends.
On December 10, 2024, we launched a share repurchase program of up to $1.5 billion over 18 months, which is expected to complete by the end of February 2026. As of October 31, 2025, we had repurchased approximately 10,858,364 ordinary shares at a cost of $716 million under this program. On December 9, 2025, we announced a new share repurchase program of up to $1.5 billion commencing on March 2, 2026, which is expected to complete by the end of April 2027.
Equity Compensation Plan Information
The table below provides information about Ashtead Shares that may be issued upon exercise of options, warrants and rights under Ashtead’s equity compensation plans as of April 30, 2025.
| Plan category |
Number of securities to be issued upon exercise of outstanding options, warrants and rights(a) |
Weighted-average exercise price of outstanding options, warrants and rights(b) |
Number of securities remaining available for future issuance under equity compensation plans (excluding securities reflected in column (a))(c) |
|||||||||
| Equity compensation plans approved by security holders |
2,061,738 | (1) | — | — | (2) | |||||||
| Equity compensation plans not approved by security holders |
— | — | — | |||||||||
| Total |
2,061,738 | — | — | |||||||||
119
Table of Contents
| (1) | Consists of 2,061,738 Ashtead Shares to be transferred to participants pursuant to RSUs and PSUs under the LTIP (assuming the maximum number of PSUs are earned). Does not include 128,365 Ashtead Shares to be transferred to participants pursuant to vested RSUs and PSUs for which settlement has been deferred in accordance with the NQDC Plan. |
| (2) | As is typical for an entity listed on the LSE, there is no limit expressed for the number of Ashtead Shares that Ashtead may purchase, through its employee share ownership trust, to satisfy awards under the LTIP. The LTIP does, however, restrict the number of Ashtead Shares that Ashtead can newly issue to satisfy equity awards under the LTIP, such that Ashtead cannot (a) grant equity awards that would result in the new issuance of Ashtead Shares or the transfer of treasury shares that, when aggregated with awards issued and outstanding under all of Ashtead’s other equity plans, would exceed 10% of Ashtead’s issued equity share capital (adjusted for share issuance and cancellation) in any rolling 10-year period or (b) grant equity awards to executives that would result in the new issuance of Ashtead Shares or the transfer of treasury shares that, when aggregated with issued and outstanding awards held by executives under Ashtead’s other discretionary (non all-employee) equity plans, would exceed 5% of the issued ordinary share capital of Ashtead’s issued equity share capital (adjusted for share issuance and cancellation) in any rolling 10-year period. |
Item 10. Recent Sales of Unregistered Securities.
During the three-year period ending on the date of this Registration Statement, the Company has not issued unregistered securities to any person, except as described below.
Equity Securities
Since January 27, 2023, we have granted an aggregate of 2,375,445 RSUs and PSUs covering an equivalent number of Ashtead Shares (in the case of PSUs, assuming maximum performance) to certain directors, employees, consultants and other service providers under the LTIP. See Item 6 (Executive Compensation) for further information on the LTIP.
These issuances did not involve any underwriters, underwriting discounts or commissions or any public offering. The offers, sales and issuances of the securities described above were deemed to be exempt from registration under Rule 701 promulgated under the Securities Act as transactions under compensatory benefit plans and contracts relating to compensation, under Section 4(a)(2) of the Securities Act as a transaction by an issuer not involving a public offering and/or under Regulation S of the Securities Act as offerings and sales made outside the United States. The recipients of such securities were our directors, employees or bona fide consultants or other service providers and received the securities under Ashtead’s equity incentive plans. Appropriate legends were affixed to the securities issued in these transactions. Each of the recipients of securities in these transactions had adequate access, through employment, business or other relationships, to information about Sunbelt Rentals.
Debt Securities
On July 27, 2023, Ashtead Capital, Inc. issued $750 million aggregate principal amount of 5.950% Senior Notes due 2033 at an issue price of 99.912% of the principal amount thereof, resulting in approximately $744 million of net proceeds, which were used for general corporate purposes, after deducting the initial purchasers’ discount and the estimated expenses of the offering of the notes. The initial purchasers for the notes issued were BofA Securities, Inc., Citigroup Global Markets Inc., J.P. Morgan Securities LLC, Wells Fargo Securities, LLC, NatWest Markets Securities Inc., MUFG Securities Americas Inc., Truist Securities, Inc., HSBC Securities (USA) Inc., SMBC Nikko Securities America, Inc., Barclays Capital Inc. and Lloyds Securities Inc. The notes were offered and sold to persons reasonably believed to be qualified institutional buyers pursuant to Rule 144A under the Securities Act and to non-U.S. persons outside the United States in compliance with Regulation S under the Securities Act.
On January 29, 2024, Ashtead Capital, Inc. issued $850 million aggregate principal amount of 5.800% Senior Notes due 2034 at an issue price of 99.611% of the principal amount thereof, resulting in approximately $840 million of net proceeds, which were used for general corporate purposes, after deducting the initial purchasers’ discount and the estimated expenses of the offering of the notes. The initial purchasers for the notes issued were J.P. Morgan Securities LLC, NatWest Markets Securities Inc., Wells Fargo Securities, LLC,
120
Table of Contents
BofA Securities, Inc., HSBC Securities (USA) Inc., Truist Securities, Inc., Citigroup Global Markets Inc., SMBC Nikko Securities America, Inc., TD Securities (USA) LLC, Barclays Capital Inc. and Lloyds Securities Inc. The notes were offered and sold to persons reasonably believed to be qualified institutional buyers pursuant to Rule 144A under the Securities Act and to non-U.S. persons outside the United States in compliance with Regulation S under the Securities Act.
Item 11. Description of Registrant’s Securities to be Registered.
The following summary of certain provisions of our capital stock does not purport to be complete and is subject to the Sunbelt Rentals Organizational Documents and the provisions of applicable law. All Ashtead shareholders are encouraged to read each of the Sunbelt Rentals Certificate of Incorporation and Sunbelt Rentals Bylaws, substantially in the form attached hereto as Exhibits 3.1 and 3.2, respectively.
Authorized Capitalization
The total amount of our authorized capitalized stock will consist of 2,500,000,000 shares of Sunbelt Rentals Common Stock and 25,000,000 shares of Sunbelt Rentals Preferred Stock. We expect to have approximately 416,096,962 shares of Sunbelt Rentals Common Stock (calculated based on the number of Ashtead Shares issued and outstanding on January 20, 2026 without giving effect to share repurchases and any shares that may be issued with respect to outstanding equity awards) and no shares of Sunbelt Rentals Preferred Stock outstanding immediately after the Scheme Effective Date.
Sunbelt Rentals Common Stock
Voting Rights. Each holder of Sunbelt Rentals Common Stock will be entitled to one (1) vote in person or by proxy for each share of Sunbelt Rentals Common Stock held of record by such holder. The holders of shares of Sunbelt Rentals Common Stock will not have cumulative voting rights. Except as otherwise required in the Sunbelt Rentals Certificate of Incorporation or by applicable law, the holders of Sunbelt Rentals Common Stock will vote together as a single class on all matters on which stockholders are generally entitled to vote.
Dividend Rights. Subject to the rights of the holders of any outstanding series of Sunbelt Rentals Preferred Stock or any class or series of stock having a preference over or the right to participate with Sunbelt Rentals Common Stock with respect to the payment of dividends, and subject to any other provisions of the Sunbelt Rentals Certificate of Incorporation and applicable law, holders of Sunbelt Rentals Common Stock will be entitled to receive such dividends and other distributions in cash, securities or other property of Sunbelt Rentals when, as and if declared thereon by the Sunbelt Rentals Board from time to time out of assets of Sunbelt Rentals legally available therefor.
Rights upon Liquidation. In the event of any liquidation, dissolution or winding up, whether voluntary or involuntary, holders of shares of Sunbelt Rentals Common Stock will be entitled to receive equally on a per share basis the remaining assets and funds of Sunbelt Rentals available for distribution to stockholders after payment of all debts and other liabilities and subject to the rights of any holders of any outstanding series of Sunbelt Rentals Preferred Stock or any class or series of stock having a preference over or the right to participate with the Sunbelt Rentals Common Stock that may at the time be outstanding.
Sunbelt Rentals Preferred Stock
The Sunbelt Rentals Board is expressly authorized, without any action or vote by the Company’s stockholders (except as may otherwise be provided by the terms of any class or series of Sunbelt Rentals Preferred Stock then outstanding), subject to limitations prescribed by law, to provide, by resolution or resolutions, for the issuance of shares of Sunbelt Rentals Preferred Stock in one or more series, and with respect to each series, to establish the number of shares to be included in each such series, and to fix the voting powers
121
Table of Contents
(if any), designations, powers, preferences, and relative, participating, optional or other rights, if any, of the shares of each such series, and any qualifications, limitations or restrictions thereof. The powers (including voting powers), preferences, and relative, participating, optional and other special rights of each series of Sunbelt Rentals Preferred Stock and the qualifications, limitations or restrictions thereof, if any, may differ from those of any and all other series at any time outstanding. The issuance of Sunbelt Rentals Preferred Stock could have the effect of decreasing the trading price of Sunbelt Rentals Common Stock, restricting dividends on the capital stock of Sunbelt Rentals, diluting the voting power of Sunbelt Rentals Common Stock, impairing the liquidation rights of the capital stock of Sunbelt Rentals, or delaying or preventing a change in control of Sunbelt Rentals.
Dividends
The Sunbelt Rentals Board has discretion over whether and when to distribute dividends, subject to the Sunbelt Rentals Organizational Documents and certain requirements of Delaware law. If we decide to pay dividends, the form, frequency and amount will depend upon our future operations and earnings, capital requirements and surplus, general financial condition, contractual restrictions and other factors that the Sunbelt Rentals Board may deem relevant.
Annual Stockholder Meetings
The Sunbelt Rentals Bylaws provide that the annual meeting of stockholders for the election of directors and for the transaction of such other business as may properly come before the meeting in accordance with the Sunbelt Rentals Bylaws will be held at such date, time and place, if any, as will be determined by the Sunbelt Rentals Board and stated in the notice of the meeting. To the extent permitted under applicable law, the meeting can be held in whole or in part by means of remote communication.
Election and Removal of Directors; Vacancies
Sunbelt Rentals will have an unclassified board and, in accordance with Ashtead’s usual practice, members of the Sunbelt Rentals Board will stand for election each year. To be elected, director candidates must receive the affirmative vote of the holders of a majority of votes cast at the meeting for the election of directors at which a quorum is present, except that in the case of a contested election, the election will be determined by a plurality of the votes of the shares present in person or represented by proxy at the meeting and entitled to vote on the election of directors.
Subject to the rights of the holders of any series of Sunbelt Rentals Preferred Stock then outstanding, directors of Sunbelt Rentals may be removed from office at any time with or without cause by the affirmative vote of the holders representing a majority of the voting power of the then outstanding shares of Sunbelt Rentals stock entitled to vote generally in the election of directors, at a meeting of stockholders called for that purpose. Subject to the rights of the holders of any series of Sunbelt Rentals Preferred Stock then outstanding, the Sunbelt Rentals Board has the power to determine from time to time the number of directors constituting the board by resolution, but the number of directors shall be no less than two and no more than 15. Newly created directorships resulting from any increase in the authorized number of directors and vacancies on the Sunbelt Rentals Board resulting from the death, resignation, disqualification or removal of a director (or any other cause) will only be filled by the affirmative vote of a majority of the directors then in office or by a sole remaining director, even though less than a quorum of the Sunbelt Rentals Board, and any director appointed in this manner will hold office until the first annual meeting of stockholders held after such director’s appointment for the purpose of electing directors and, unless the number of directors is reduced effective at such annual meeting of stockholders in accordance with the provisions of the Sunbelt Rentals Organizational Documents, until such director’s successor will have been elected and qualified or until his or her earlier death, resignation, disqualification or removal.
122
Table of Contents
Quorum
Unless otherwise required by law or the Sunbelt Rentals Organizational Documents, at each meeting of stockholders, a majority in voting power of the outstanding shares of Sunbelt Rentals stock entitled to vote at the meeting, present in person or represented by proxy, will constitute a quorum for the transaction of business. The chair of the meeting will have the power to recess, reschedule, postpone or adjourn meetings of stockholders for any (or no) reason from time to time and, if a quorum will not be present or represented by proxy at any meeting of the stockholders, the stockholders present in person or represented by proxy will also have the power, by the affirmative vote of a majority in voting power present and entitled to vote thereon, to adjourn the meeting from time to time, in the manner provided in the Sunbelt Rentals Bylaws, until a quorum will be present or represented by proxy.
Authorized but Unissued Capital Stock
Delaware law does not require stockholder approval for any issuance of authorized shares. However, the listing requirements of the NYSE, which would apply if and so long as the Sunbelt Rentals Common Stock remains listed on the NYSE, require stockholder approval of certain issuances equal to or exceeding 20% of the then outstanding voting power or then outstanding number of shares of Sunbelt Rentals Common Stock. Additional shares that may be issued in the future may be used for a variety of corporate purposes, including future public offerings, to raise additional capital or to facilitate acquisitions.
One of the effects of the existence of unissued and unreserved Sunbelt Rentals Common Stock may be to enable the Sunbelt Rentals Board to issue shares to persons friendly to current management without offering pre-emptive rights to existing stockholders, which issuance could render more difficult or discourage an attempt to obtain control of Sunbelt Rentals by means of a merger, tender offer, proxy contest or otherwise and thereby protect the continuity of management and possibly deprive stockholders of opportunities to sell their shares of Sunbelt Rentals Common Stock at prices higher than prevailing market prices.
Special Meetings
Unless otherwise required by law or by the Sunbelt Rentals Organizational Documents, special meetings of stockholders, for any purpose or purposes, may be called by (i) the Chair of the Sunbelt Rentals Board or the Chief Executive Officer, (ii) the Corporate Secretary within 10 calendar days after receipt of a written request of a majority of the Sunbelt Rentals Board to call a special meeting of stockholders, or (iii) the Corporate Secretary after receipt of one or more valid written requests to call a special meeting of stockholders from stockholders of record (a Special Meeting Request) who collectively Own (as defined in the Sunbelt Rentals Bylaws), in the aggregate, at least 25% of the voting power of the outstanding shares of Sunbelt Rentals stock then entitled to vote on the matter to be brought before the proposed special meeting, in each case, subject to the requirements and limitations set forth in the Sunbelt Rentals Bylaws. The Sunbelt Rentals Bylaws limit business transacted at a special meeting of stockholders to only such business brought before the meeting pursuant to Sunbelt Rentals’ notice of meeting and the purpose stated by the person calling the special meeting or, in the case of a stockholder-requested special meeting, the purpose stated in the Special Meeting Request, provided that the Sunbelt Rentals Board is not prohibited from submitting matters to the stockholders at any special meeting. These provisions may have the effect of deferring, delaying or discouraging hostile takeovers or changes in control or management of Sunbelt Rentals.
Stockholder Action by Written Consent
Pursuant to Section 228 of the DGCL, any action required to be taken at any annual or special meeting of stockholders may be taken without a meeting, without prior notice and without a vote, if a consent or consents in writing, setting forth the action so taken, is signed by the holders of outstanding stock having not less than the minimum number of votes that would be necessary to authorize or take such action at a meeting at which all shares of a corporation’s stock entitled to vote thereon were present and voted, unless the corporation’s
123
Table of Contents
certificate of incorporation provides otherwise. The Sunbelt Rentals Certificate of Incorporation provides that any action required or permitted to be taken by the stockholders of Sunbelt Rentals may be taken only at a duly called annual or special meeting of stockholders, and the power of stockholders to act by consent without a meeting is specifically denied; however, any action required or permitted to be taken solely by the holders of Sunbelt Rentals Preferred Stock may be taken without a meeting to the extent so provided in the resolutions creating such series of Sunbelt Rentals Preferred Stock.
Amendments to the Sunbelt Rentals Organizational Documents
The DGCL governs the procedures under which a Delaware corporation may amend its certificate of incorporation. Subject to certain exceptions, the DGCL generally requires any amendment of the certificate of incorporation to be approved by (a) the board of directors of the corporation and (b) the holders of a majority of the then outstanding shares of capital stock of the corporation, unless the certificate of incorporation requires a higher vote. If the capital stock of a corporation is classified into different classes, certain amendments to the certificate of incorporation of a Delaware corporation also require a separate class vote. Furthermore, Delaware corporations are also permitted to amend their certificate of incorporation without a stockholder vote to change the name of the corporation and to effect certain types of forward stock splits and associated increases in the authorized number of shares. The Sunbelt Rentals Certificate of Incorporation provides that any provisions therein may be amended, altered or repealed in the manner prescribed by the DGCL.
The Sunbelt Rentals Organizational Documents provide that the Sunbelt Rentals Bylaws may be amended, altered or repealed from time to time by either (i) the Sunbelt Rentals Board or (ii) the affirmative vote of holders of a majority of the voting power of the then outstanding shares of Sunbelt Rentals stock entitled to vote thereon, which vote will be in addition to any vote of the holders of any class or series of capital stock of Sunbelt Rentals required by the Sunbelt Rentals Certificate of Incorporation (including any certificate of designation relating to any series of Sunbelt Rentals Preferred Stock).
Limitations on Liability and Indemnification of Officers and Directors
The DGCL authorizes corporations to limit or eliminate the personal liability of directors and certain officers to corporations and their stockholders for monetary damages for breaches of their respective fiduciary duties, subject to certain exceptions. Under the Sunbelt Rentals Organizational Documents, to the fullest extent permitted by the DGCL, a director or officer of Sunbelt Rentals will not be personally liable to Sunbelt Rentals or any of its stockholders for monetary damages for any breach of fiduciary duty as a director or officer. Currently, the DGCL does not permit exculpation of: (i) a director or officer for breach of the director’s or officer’s duty of loyalty to Sunbelt Rentals or its stockholders; (ii) a director or officer for acts or omissions not in good faith or which involve intentional misconduct or a knowing violation of law; (iii) a director for unlawful payment of dividends or unlawful stock repurchases or redemptions, as provided under Section 174 of the DGCL; (iv) a director or officer for any transaction from which the director or officer derived an improper personal benefit; or (v) an officer in any action by or in the right of the Corporation. Under the Sunbelt Rentals Organizational Documents, Sunbelt Rentals is required to indemnify each of its directors and certain of its officers, to the fullest extent permitted by the DGCL, subject to certain exceptions.
Exclusive Jurisdiction of Certain Actions
The Sunbelt Rentals Certificate of Incorporation requires, unless Sunbelt Rentals consents in writing to the selection of an alternative forum, that the Court of Chancery of the State of Delaware (or, if and only if the Court of Chancery lacks subject matter jurisdiction, any state court located within the State of Delaware or, if and only if all such state courts lack subject matter jurisdiction, the federal district court for the District of Delaware) and any appellate court therefrom will, to the fullest extent permitted by law, be the sole and exclusive forum for: (i) any derivative action or proceeding brought on behalf of Sunbelt Rentals; (ii) any action asserting a claim of breach of a duty (including any fiduciary duty) by, or other wrongdoing by, any current or former director,
124
Table of Contents
officer, employee, agent or stockholder of Sunbelt Rentals to Sunbelt Rentals or Sunbelt Rentals’ stockholders; (iii) any action asserting a claim against Sunbelt Rentals or any current or former director, officer, employee, agent or stockholder of Sunbelt Rentals arising out of or relating to any provision of the DGCL, the Sunbelt Rentals Certificate of Incorporation or the Sunbelt Rentals Bylaws; (iv) any action to interpret, apply, enforce or determine the validity of the Sunbelt Rentals Certificate of Incorporation or the Sunbelt Rentals Bylaws; (v) any action asserting a claim against Sunbelt Rentals or any current or former director, officer, employee, agent or stockholder of Sunbelt Rentals governed by the internal affairs doctrine; (vi) any action asserting an “internal corporate claim” as that term is defined in Section 115 of the DGCL; or (vii) any action as to which the DGCL confers jurisdiction on the Court of Chancery. This exclusive forum provision may not apply to suits brought to enforce a duty or liability vested in the exclusive jurisdiction of a court or forum other than the Court of Chancery, such as those created by the Exchange Act or any other claim for which the federal courts have exclusive jurisdiction. In addition, the Sunbelt Rentals Certificate of Incorporation provides that, unless Sunbelt Rentals consents in writing to the selection of an alternative forum, to the fullest extent permitted by law, the federal district courts of the United States will be the sole and exclusive forum for the resolution of any complaint asserting a cause of action under the Securities Act against Sunbelt Rentals or any director, officer, employee or agent of Sunbelt Rentals.
Anti-Takeover Provisions
Provisions in the Sunbelt Rentals Organizational Documents may discourage, delay or prevent a merger, acquisition or other change in control of Sunbelt Rentals that certain stockholders may consider favorable, including transactions in which stockholders might otherwise receive a premium for their stock. These provisions could also limit the price that investors might be willing to pay in the future for Sunbelt Rentals Common Stock, thereby depressing the market price of Sunbelt Rentals Common Stock. In addition, these provisions may frustrate or prevent any attempts by stockholders of Sunbelt Rentals to replace or remove its current management by making it more difficult for stockholders to replace members of the Sunbelt Rentals Board. Among other things, these provisions:
| • | provide the Sunbelt Rentals Board with the right to issue one or more series of Sunbelt Rentals Preferred Stock and to determine the price and other terms of such preferred stock, including preferences and voting rights, without stockholder approval; |
| • | authorize a number of shares of Sunbelt Rentals Common Stock that are not yet issued, which would allow the Sunbelt Rentals Board to issue stock to persons friendly to current management without offering pre-emptive rights to existing stockholders; |
| • | permit the Sunbelt Rentals Board to amend the Sunbelt Rentals Bylaws, which may allow the Sunbelt Rentals Board to take additional actions to prevent an unsolicited takeover and inhibit the ability of an acquirer to amend the bylaws to facilitate an unsolicited takeover attempt; |
| • | prohibit stockholders from taking action by written consent; |
| • | only permit stockholders who collectively own stock representing, in the aggregate, at least 25% of the voting power of the then outstanding shares to call a special meeting; |
| • | do not permit cumulative voting in the election of directors, which limits the ability of minority stockholders to elect director candidates; |
| • | provide the Sunbelt Rentals Board with the sole authority to determine the number of directors of the Sunbelt Rentals Board and to fill vacancies on the Sunbelt Rentals Board (whether resulting from an increase in the authorized number of directors or otherwise); and |
| • | establish advance notice and other requirements for nominations of candidates for election to the Sunbelt Rentals Board or for proposing matters that can be acted on by stockholders at annual or special meetings of stockholders. |
125
Table of Contents
Section 203 of the DGCL
As a Delaware corporation, Sunbelt Rentals will be subject to provisions of Delaware law, including Section 203 of the DGCL. Section 203 of the DGCL provides (in general) that, unless certain conditions have been met, Sunbelt Rentals may not engage in a business combination with an interested stockholder (generally defined as a stockholder of Sunbelt Rentals, together with his or her affiliates or associates, who owns more than 15% of Sunbelt Rentals’ voting stock) for a period of three years after the time of the transaction in which the person became an interested stockholder. The prohibition on business combinations with interested stockholders does not apply in some cases, including if: (1) the Sunbelt Rentals Board, prior to the time of the transaction in which the stockholder became an interested stockholder, approves the business combination or the transaction in which the stockholder becomes an interested stockholder; (2) upon consummation of the transaction that resulted in the stockholder becoming an interested stockholder, the interested stockholder owned at least 85% of the voting stock (excluding stock owned by certain persons) of Sunbelt Rentals outstanding at the time the transaction commenced; or (3) at or after the time at which the person became an interested stockholder, the Sunbelt Rentals Board and the holders of at least two-thirds of the outstanding voting stock not owned by the interested stockholder approve, at an annual or special meeting of stockholders, and not by written consent, the business combination. Any provision of the Sunbelt Rentals Organizational Documents or Delaware law that has the effect of delaying or deterring a change in control could limit the opportunity for Sunbelt Rentals stockholders to receive a premium for their Sunbelt Rentals Common Stock and affect the price that some investors are willing to pay for the Sunbelt Rentals Common Stock.
The Sunbelt Rentals Organizational Documents
If the Redomiciliation is consummated, beginning on the Scheme Effective Date, the Sunbelt Rentals Organizational Documents and the DGCL will govern Sunbelt Rentals and your rights as a stockholder of Sunbelt Rentals, instead of the Ashtead Articles and the U.K. Companies Act 2006.
Comparison of Corporate Governance and Stockholder Rights
Ashtead is a public limited company incorporated in England and Wales under English law. English law and the Ashtead Articles govern the rights of Ashtead Shareholders. Sunbelt Rentals is a corporation incorporated under Delaware Law. Delaware corporate law differs in some material respects from English corporate law. In addition, the Sunbelt Rentals Organizational Documents will differ in certain material respects from the Ashtead Articles. As a result, the rights held by Sunbelt Rentals stockholders will differ in some regards as compared to the rights held by Ashtead Shareholders.
| Topic |
English law |
Delaware law | ||||
| A. Share capital and distributions | ||||||
| 1. |
Dividends and distributions | • Subject to a company’s articles of association, shareholders have the right to receive a proportion of dividends pro rata to their percentage ownership.
• Different share classes may have different dividend rights. Ashtead only has a single class of shares in issue.
• Dividends can only be paid out of a company’s distributable reserves. These reserves can be created by a |
• Subject to a company’s certificate of incorporation and bylaws, stockholders have the right to receive a proportion of dividends pro rata to their percentage ownership.
• Different stock classes may have different dividend rights. Sunbelt Rentals will only have one class of shares in issue.
• Dividends can only be paid either: (i) out of a company’s surplus (defined as net assets minus capital); or (ii) if there is no | |||
126
Table of Contents
| Topic |
English law |
Delaware law | ||||
| reduction of share capital (see below).
• Dividends can be: (i) final dividends (which are recommended by the directors and declared by shareholders by way of an ordinary resolution); or (ii) interim dividends (which are decided and paid by the board).
• Final dividends become a debt of a company once they have been declared by the shareholders. Interim dividends become a debt only after they are paid. |
surplus, out of a company’s net profits from the prior fiscal year, provided that no dividend may be paid from net profits if the company’s capital is less than the aggregate amount of capital represented by the issued and outstanding shares of classes having a preference on the distribution of assets.
• Dividends are declared by a company’s board of directors. Stockholders do not vote for or approve the declaration or payment of dividends.
• There is no concept of “interim” or “final” distributions in Delaware. | |||||
| 2. |
Share buybacks | • Public companies such as Ashtead may buy back or redeem their own shares, provided that: (i) they comply with certain procedural requirements (including seeking shareholder approval); and (ii) there are no restrictions contained within their articles of association. There are no restrictions on share buybacks in the Ashtead Articles and a general authority for Ashtead to purchase its own shares was sought at Ashtead’s 2024 annual general meeting.
• Share buybacks must be financed out of distributable profits or the proceeds of a fresh issue of shares made for the purpose of financing the buyback.
• Public companies such as Ashtead must also comply with relevant U.K. market abuse regulations which cover, for example, share buyback safe harbor procedures which can be relied upon in the event that relevant buyback program complies with certain conditions relating to manner of purchase, timing, price and volume. |
• A company may buy back or redeem its own shares without stockholder approval, provided that the company’s capital is not impaired and such share buyback would not cause capital impairment (which has been interpreted to mean that a company may only use surplus (defined as net assets minus capital) to effect such share buyback).
• Issuer tender offers are subject to significant procedural and disclosure requirements under the Exchange Act.
• Rule 10b-18 under the Exchange Act provides a safe harbor from liability for market manipulations, which can be relied upon in the event that a relevant buyback program complies with certain conditions relating to manner of purchase, timing, price and volume. | |||
| 3. |
Winding up and dissolution | • Subject to a company’s articles of association, shareholders are entitled to a share of the proceeds on the winding-up of the company.
• Shareholders may under certain circumstances seek the winding-up of |
• Subject to a company’s certificate of incorporation and bylaws, stockholders are entitled to a share of the assets of a winding-up company following payment of any claimants. | |||
127
Table of Contents
| Topic |
English law |
Delaware law | ||||
| the company following payment of any claimants. |
• Dissolution must be approved by either: (i) the resolution of a majority of the board followed by approval of a majority of stockholders; or (ii) the unanimous written consent of all stockholders. | |||||
| 4. |
Authority to allot shares (and filings connected with increases in authorized capital) | • Authority for the directors to allot shares, or to grant rights to subscribe for or to convert any security into shares, may be included in the company’s articles of association and/or the shareholders may pass a resolution giving the directors such authority. There is no concept of a maximum authorized share capital for U.K. companies.
• The Ashtead Articles provide that Ashtead can issue shares with any rights or restrictions attached to them as may be determined by ordinary resolution passed by the shareholders or, subject to receiving the requisite authority to allot shares, by the directors.
• As a public company, Ashtead must also comply with certain requirements under the U.K. Listing Rules in relation to the conduct of open offers, rights issues and placings. |
• A company’s certificate of incorporation includes a specific maximum number of authorized shares of each class. The board may authorize the issuance of shares up to the amount specified in the certificate of incorporation without needing to seek stockholder approval under Delaware law.
• NYSE may require stockholder approval of certain share issuances, including for the issuance of 20% or more of a company’s outstanding shares of common stock in private offerings where the shares are sold at a discount to market, as well as in connection with certain issuances to related parties.
• An amendment to the certificate of incorporation is required to effect any increase in authorized shares or consolidation or subdivision of shares. Such amendment must receive the approval of a majority of stockholders who vote on such amendment, unless a higher threshold is set forth in the company’s certificate of incorporation. | |||
| 5. |
Pre-emption rights | • Shares in a company cannot be issued for cash to any person until an offer has been made (on the same or more favorable terms) to each existing shareholder to subscribe for a proportionate part of any such shares that are issued by the company pro-rata in accordance with their existing holding.
• Ashtead Shareholders approve an annual authority in respect of the disapplication of pre-emption rights at its annual general meetings in accordance with guidance set out by the Pre-Emption Group in the United Kingdom and guidance from proxy advisers. |
• Unless provided otherwise in a company’s certificate of incorporation or any stockholder agreement, stockholders do not have any pre-emptive rights to subscribe to additional issuances of the company’s shares.
• Sunbelt Rentals stockholders will not have any pre-emptive rights. | |||
128
Table of Contents
| Topic |
English law |
Delaware law | ||||
| 6. |
Treasury shares | • Once shares are held as treasury shares, the usual rights attaching to shares (including voting and dividend rights) are suspended and the shares effectively lie dormant pending their sale, transfer or cancellation.
• A company may resell treasury shares for cash consideration. Treasury shares can also be used in connection with employee share schemes. |
• Once shares are held as treasury shares, the usual rights attaching to shares (including voting and dividend rights) are suspended and the shares effectively lie dormant pending their sale, transfer or retirement.
• A company may resell treasury shares for greater or less than, or equal to, the par value (if any) of such shares and for cash, property or any combination thereof.
• Treasury shares may be retired by the board such that they resume the status of authorized but unissued shares. | |||
| 7. |
Limited liability of shareholders | • The liability of a shareholder to a company is limited to the amount (if any) which remains unpaid in respect of their shares. All shares in issue in Ashtead are fully paid up.
• In the event of an insolvent liquidation, the liquidator is not entitled to any contribution from shareholders to meet the company’s unsatisfied liabilities beyond the amounts (if any) which remain unpaid in respect of its share capital. |
• Unless provided otherwise in a company’s certificate of incorporation, stockholders are not personally liable for the payment of the company’s debts, except as they may be liable by reason of their own conduct or acts.
• In the event of the dissolution and winding up of a company, the aggregate liability of any stockholder shall not exceed the amount distributed to such stockholder in dissolution. | |||
| B. Voting | ||||||
| 8. |
Resolutions (ordinary versus special and related filing requirements) | • An ordinary resolution of the shareholders (or of a class of shareholders) of a company is a resolution that is passed by a simple majority, i.e. when more than 50% of the votes cast are in favor of the resolution. Ordinary resolutions need only be filed with the Registrar of Companies and will be publicly available in certain circumstances.
• A special resolution of the shareholders (or of a class of shareholders) of a company is a resolution passed by a majority of not less than 75% of the votes cast are in favor of the resolution. All special resolutions must be filed at the Registrar of Companies within 15 |
• There is no concept of “ordinary” or “special” resolutions under Delaware law. The voting threshold for any particular matter is determined by a company’s certificate of incorporation and bylaws, which may impose different voting thresholds for different stockholder actions, subject to Delaware law. | |||
129
Table of Contents
| Topic |
English law |
Delaware law | ||||
| days of being passed and will then be publicly available. |
||||||
| 9. |
Voting rights – particularly on a poll and show of hands | • Subject to the rights of share classes set out in a company’s articles of association, each shareholder has a right to vote on shareholder resolutions of the company.
• Subject to a company’s articles of association, on a resolution at a meeting on a show of hands, each shareholder present has one vote. On a poll, each shareholder has one vote in respect of each share they hold. This concept is reflected in the Ashtead Articles and is subject to any special rights or restrictions as to voting which are given to any shares or upon which any shares may be held at the relevant time.
• Any five or more persons at a meeting who are entitled to vote, or the holders of not less than 10% of the voting rights in a company, can: (i) demand a poll on most resolutions; and (ii) require the directors of the company to obtain an independent report on any poll taken, or to be taken, at a general meeting.
• Voting results must be publicly disclosed. |
• Subject to a company’s certificate of incorporation, each stockholder is entitled to one vote per share.
• There is no “poll” or “show of hands” concept in Delaware; all votes and ballots are counted, with no “show of hands,” and reporting companies must publicly disclose the voting results. | |||
| 10. |
Requisitioning of resolutions | • Shareholders representing not less than 5% of a company’s paid-up voting share capital (excluding any paid-up capital held as treasury shares) can requisition a shareholder meeting by specifying a resolution to be proposed at the meeting and circulating relevant explanatory statements. |
• Stockholders of a company may call a stockholder meeting if they are given aright to do so in the company’s certificate of incorporation or bylaws and if they satisfy the conditions and procedures set forth therein. The Sunbelt Rentals Bylaws provide that stockholders who collectively own at least 25% of the voting power of the Company’s outstanding shares may request that a special stockholders’ meeting be held.
• Stockholders of a company have the right to nominate directors and propose other business to the extent set forth in the company’s certificate of incorporation or bylaws. The Sunbelt Rentals Bylaws provide that any stockholder may nominate a | |||
130
Table of Contents
| Topic |
English law |
Delaware law | ||||
| director or propose other business in connection with any annual meeting of stockholders, subject to various procedural requirements set forth in such bylaws.
• Under Rule 14a-8 under the Securities Act, in some circumstances, stockholders have the right to submit stockholder proposals, which must be included in a company’s proxy. | ||||||
| C. Minority stockholder protection | ||||||
| 11. |
Protection of non-controlling interests | • A stockholder may petition the court for an order giving relief on the grounds that a company’s affairs are being (or have been or are going to be) conducted in a manner which is unfairly prejudicial to the interests of its shareholders generally, or to some part of its shareholders (including at least the complainant shareholder).
• A shareholder may bring a derivative claim against a director on behalf of a company where the shareholder can demonstrate that the director has been negligent, in default or has committed a breach of their duties or breach of trust. |
• A stockholder may initiate a derivative suit to enforce a right of a company if the company fails to enforce such right.
• A stockholder may file a direct lawsuit against directors and majority stockholders alleging a breach of fiduciary duty. | |||
| D. Acquisitions and transfers of shares | ||||||
| 12. |
Transfers of shares | • In general, both the legal and beneficial title to shares are freely transferable at any time and to any person with capacity to hold the shares, unless transfer restrictions are contained in a company’s articles of association or shareholders’ agreement. |
• In general, both the legal and beneficial title to shares are freely transferable at any time and to any person with capacity to hold the shares, unless transfer restrictions are included in the certificate of incorporation, bylaws or a stockholder agreement.
• Shares not registered under the Securities Act may only be transferred if such shares or transfer fall under an exemption from registration or a safe harbor. | |||
| 13. |
Compulsory acquisition | • If a bidder in a takeover offer acquires or contracts to acquire 90% of the shares and voting rights it does not already own in a company, it has the statutory right to buy the shares of the minority shareholders).
• The minority shareholders have an equivalent right to require the bidder |
• A parent company can force minority stockholders to sell their shares to the parent company in certain circumstances, typically where a stockholder already owns at least 90% of the company’s common stock or where an acquiror owns at least 50% of the common | |||
131
Table of Contents
| Topic |
English law |
Delaware law | ||||
| to acquire their shares at the offer price. |
stock of a company following a friendly tender or exchange offer.
• The dissenting stockholders have rights to require the bidder to acquire their shares at fair value in certain circumstances. | |||||
| 14. |
Schemes of arrangement | • A company may implement a scheme of arrangement with its shareholders and/or creditors to achieve a number of outcomes (including solvent reorganizations, mergers and insolvent restructurings) with the support of a majority in number representing 75% in value of each class of shareholder or creditor attending and voting at the meeting. If the necessary statutory majorities are obtained and the court grants an order sanctioning the scheme, the order must then be delivered to the Registrar of Companies (following which the scheme shall become effective).
• The terms of the scheme will only become effective and binding on a company and all members of the relevant classes (including any dissenting shareholder/creditor and any shareholder/creditor who did not vote) once the court order has been delivered to the Registrar of Companies. |
• There is no Delaware equivalent of a scheme of arrangement in the business acquisition context. A company seeking to effect a merger must obtain the approval of the board of directors and the affirmative vote of stockholders holding a majority of a company’s outstanding shares with voting rights, unless the company’s certificate of incorporation requires a higher threshold for stockholder approval.
• Court approval is not required for a Delaware company to effect a merger, although other regulatory approvals may be required.
• The terms of any merger are set forth in a written agreement rather than a scheme of arrangement. | |||
| 15. |
Financial assistance | • Subject to certain exemptions, public companies are prohibited from giving financial assistance for the purpose of the acquisition of its shares or those of a parent company. The prohibition covers any financial assistance given to reduce or discharge any liability incurred by the company or any third party for the purpose of the acquisition. |
• There is no statutory restriction on any company giving financial assistance for the purpose of the acquisition of its own shares, or a subsidiary of any company giving financial assistance for the purpose of the acquisition of shares in a private holding company. | |||
| E. Information rights | ||||||
| 16. |
Access to information for shareholders | • Shareholders have the right to receive a copy of the annual report and all corporate action notices and accompanying documentation such as notices of general meetings and related proxy forms, circulars, prospectuses and offer documents. |
• Under Delaware law, stockholders as of the record date of the relevant meeting determined by the board of directors are entitled to notice of any meeting of stockholders or any adjournment thereof. Such notice must state the purpose(s) for which the meeting is called. | |||
132
Table of Contents
| Topic |
English law |
Delaware law | ||||
|
• Under the Exchange Act, a company is required to deliver a proxy statement and annual report to its stockholders before it can solicit proxies for a stockholder meeting.
• Securities exchange rules regulate the proxy solicitation process, including the preparation, filing and distribution of proxy materials to stockholders. | ||||||
| F. Shareholder meetings and directors | ||||||
| 17. |
Annual general meeting | • Public companies are obliged by statute to hold an annual general meeting each year. |
• A company is required to hold an annual meeting of stockholders every 13 months. NYSE requires each listed company to hold an annual meeting of stockholders each year. | |||
| 18. |
Quorum of shareholder meetings | • Pursuant to the Ashtead Articles, two persons entitled to vote at the meeting, present in person or represented by a proxy, shall constitute a quorum. |
• The Sunbelt Rentals Bylaws provide that a majority in voting power of the outstanding shares of the Company entitled to vote at the meeting, present in person or represented by proxy, shall constitute a quorum. | |||
| 19. |
Removal of directors | • Shareholders have the absolute power, by ordinary resolution, to remove a director from office before the expiration of their period of office. |
• Any director or the entire board may be removed by a majority stockholder vote: (i) for cause only if the board is classified (where the board of directors is divided into different classes, with each class serving staggered terms); and (ii) with or without cause if the board is not classified. Because the Sunbelt Rentals Board will not be classified, a majority of stockholders may remove a director with or without cause. | |||
| 20. |
Appointment of directors | • Pursuant to the Ashtead Articles, a director can be appointed by the board of Ashtead or following shareholder approval of an ordinary resolution.
• At every annual shareholder meeting, each of the directors shall retire from office and may offer themselves up for re-appointment by the shareholders. |
• Pursuant to the Sunbelt Rentals Bylaws, directors are elected annually by the stockholders. In an uncontested election, directors shall be elected by a majority of the votes cast, and in a contested election, directors shall be elected by a plurality of the votes cast.
• A vacancy on the board may be filled by a new director appointed by the affirmative vote of a majority of the remaining directors. | |||
133
Table of Contents
| Topic |
English law |
Delaware law | ||||
| 21. |
Indemnification of directors and officers | • Public companies can only indemnify their directors against certain liabilities to third parties, including legal costs, damages and interest awarded in civil proceedings. Public companies generally cannot protect their directors from liabilities arising from negligence or breaches of duty.
• Public companies must disclose the existence of any qualifying third-party indemnity provisions in their annual report. |
• A company may, subject to limitations set forth by law and by contract, indemnify its directors and officers for expenses or losses incurred in connection with litigation or other proceedings related to their service to the company.
• Public companies are not required to annually disclose the existence of third-party indemnification provisions, but may on occasion be required to disclose such information in connection with filing registration statements. | |||
| 22. |
Directors’ duties | • Directors owe duties to the company and not to shareholders. These include: (i) the duty to act in accordance with the company’s constitution and to use powers for the purpose for which they were conferred; (ii) the duty to promote the success of the company for the benefit of its members; (iii) the duty to exercise independent judgement; (iv) the duty to exercise reasonable care, skill and diligence; (v) the duty to avoid conflicts of interest, other than arising from a transaction/ arrangement with the company (subject to exceptions where, for example, the conflict has been authorized); (vi) the duty to declare any interest in a proposed transaction or arrangement with the company; and (vii) the duty not to accept benefits from third parties. |
• Directors owe duties both to the company and its stockholders, including the primary fiduciary duties of the duty of care and the duty of loyalty. The duty of care generally requires that a director act in good faith, with the care that an ordinarily prudent person would exercise under similar circumstances. The duty of loyalty requires that a director act in good faith and in a manner he or she reasonably believes to be in the best interests of the company. | |||
Material U.S. Federal Income Tax Considerations
The following is a discussion of the material U.S. federal income tax considerations of the Redomiciliation generally applicable to holders of Ashtead Shares as well as certain material U.S. federal income tax considerations related to owning and disposing of Sunbelt Rentals Common Stock (including depositary interests representing Sunbelt Rentals Common Stock (Sunbelt Rentals DIs)) that are generally applicable to Non-U.S. Holders (as defined below). This discussion is based on present law of certain U.S. federal income tax considerations relevant to the cancellation of Ashtead Shares, the issuing of Sunbelt Rentals Common Stock (including Sunbelt Rentals DIs) pursuant to the Redomiciliation and the ownership of Sunbelt Rentals Common Stock. It addresses only Ashtead Shareholders that hold their Ashtead Shares and will hold their Sunbelt Rentals Common Stock as “capital assets” within the meaning of Section 1221 of the Internal Revenue Code and use the U.S. dollar as their functional currency. Although not free from doubt, a holder of a Sunbelt Rentals DI generally should be treated for U.S. federal income tax purposes as holding the Sunbelt Rentals Common Stock represented by the Sunbelt Rentals DI. The following discussion assumes that such treatment applies and
134
Table of Contents
references below to Sunbelt Rentals Common Stock include references to Sunbelt Rentals DIs. Holders of Sunbelt Rentals DIs should consult their tax advisers regarding the U.S. federal income tax consequences to them relating to the matters discussed below.
This summary is for general information only and is not a substitute for tax advice. It is not a complete description of all of the tax considerations that may be relevant to a particular Ashtead Shareholder. This discussion is based on the Internal Revenue Code proposed, temporary and final Treasury Regulations promulgated under the Internal Revenue Code (the Treasury Regulations), and judicial and administrative interpretations thereof as of the date hereof. It does not address all of the considerations relevant to Ashtead Shareholders subject to special tax regimes, such as banks and other financial institutions, insurance companies, dealers in currencies and securities, traders in securities that elect mark-to-market treatment, regulated investment companies, real estate investment trusts, tax-exempt entities, U.S. expatriates, investors liable for alternative minimum tax or persons holding Ashtead Shares or Sunbelt Rentals Common Stock as part of a hedge, straddle, conversion or other integrated financial transaction. It does not consider consequences for persons that own directly, indirectly or constructively, 5% or more (by voting power or value) of the equity interests of Ashtead or of Sunbelt Rentals. It also does not address U.S. federal non-income taxes (such as estate and gift tax) the application of the Medicare tax on net investment income under Section 1411 of the Internal Revenue Code, or U.S. state and local tax or non-U.S. tax considerations.
If you are a partnership (or other pass-through entity) for U.S. federal income tax purposes, the tax treatment of your partners (or other owners) will generally depend on the status of the partners, the activities of the partnership and certain determinations made at the partner level. Accordingly, partnerships (or other pass-through entities) and the partners (or other owners) in such partnerships (or such other pass-through entities) should consult their tax advisers regarding the U.S. federal income tax consequences to them relating to the matters discussed below.
Treatment as a result of the Redomiciliation
For U.S. federal income tax purposes, the Redomiciliation is intended to qualify as either a reorganization within the meaning of Section 368(a) of the Internal Revenue Code, a tax-free exchange within the meaning of Section 351 of the Internal Revenue Code, or both (collectively, the Intended Tax Treatment). The proper U.S. federal income treatment of the Redomiciliation is not certain, however, and neither Ashtead nor Sunbelt Rentals has sought a ruling from U.S. federal tax authorities on the proper treatment of the Redomiciliation. If the IRS were to successfully challenge the Intended Tax Treatment, the tax consequences would differ from those set forth herein, and holders could be subject to U.S. federal income tax upon the receipt of Sunbelt Rentals Common Stock in the Redomiciliation.
Although the discussion in this section assumes that the Redomiciliation constitutes a tax-free reorganization or a tax-free incorporation exchange, shareholders should consult their own tax advisers about the proper U.S. federal, state and local income tax treatment of the Redomiciliation.
U.S. Holders
For purposes of this discussion, U.S. Holder means a beneficial owner of Ashtead Shares or Sunbelt Rentals Common Stock that for U.S. federal income tax purposes is: (i) an individual citizen or resident of the U.S.; (ii) a corporation organized in or under the laws of the U.S., any state thereof, or the District of Columbia; (iii) a trust that: (1) is subject to the primary supervision of a U.S. court and the control of one or more “United States persons” (within the meaning of Section 7701(a)(30) of the Internal Revenue Code); or (2) has a valid election in effect to be treated as a U.S. person for U.S. federal income tax purposes; or (iv) an estate the income of which is subject to U.S. federal income taxation regardless of its source.
135
Table of Contents
Effects of the Redomiciliation to U.S. Holders
Assuming that the Redomiciliation is a tax-free reorganization or a tax-free incorporation exchange, a U.S. Holder will recognize no gain or loss on the cancellation of Ashtead Shares and the issue of Sunbelt Rentals Common Stock. A U.S. Holder’s basis in Sunbelt Rentals Common Stock will equal such U.S. Holder’s aggregate adjusted tax basis in the Ashtead Shares cancelled in the Redomiciliation, and a U.S. Holder’s holding period in the Sunbelt Rentals Common Stock will include the period such U.S. Holder held the Ashtead Shares. If a U.S. Holder acquired different blocks of Ashtead Shares at different times or at different prices, the U.S. Holder’s basis and holding period in the Sunbelt Rentals Common Stock will be determined separately for each block of Ashtead Shares.
U.S. Holders may be required to attach to their tax returns for the year in which they receive Sunbelt Rentals Common Stock a statement regarding application of the tax-free reorganization requirements (including information about the Ashtead Shares cancelled and the Sunbelt Rentals Common Stock issued) and to maintain certain records regarding the Redomiciliation.
Passive Foreign Investment Company
Ashtead believes, and this discussion assumes, that Ashtead currently is not, has not been, and, prior to the Scheme Effective Date, will not become a passive foreign investment company (generally, a non-U.S. corporation that has a specified percentage of “passive” income or assets, after the application of certain “look-through” rules) for U.S. federal income tax purposes. However, there can be no assurances in this regard. If Ashtead were a passive foreign investment company for any taxable year during which a U.S. Holder held Ashtead Shares, certain adverse tax consequences could apply to such U.S. Holder as a result of the Redomiciliation. A U.S. Holder should consult its own tax adviser with respect to the U.S. federal income tax consequences of the Scheme if such U.S. Holder believes that Ashtead was a passive foreign investment company for any taxable year during which it held Ashtead Shares.
U.S. Holders are encouraged to consult their tax advisers to determine the specific tax consequences to them of the Redomiciliation, including the effect of any U.S. federal, state, local, non-U.S. or other tax laws.
Non-U.S. Holders
For purposes of this discussion, “Non-U.S. Holder” means a beneficial owner of Ashtead Shares or Sunbelt Rentals Common Stock that for U.S. federal income tax purposes is neither a U.S. Holder nor an entity classified as a partnership for U.S. federal income tax purposes.
Effects of the Redomiciliation to Non-U.S. Holders
A Non-U.S. Holder generally will not be subject to U.S. federal income tax on any gain realized on the cancellation of Ashtead Shares or the issue of Sunbelt Rentals Common Stock in the Redomiciliation. A Non-U.S. Holder generally will not recognize any loss realized on the cancellation of Ashtead Shares or issue of Sunbelt Rentals Common Stock in the Redomiciliation for U.S. federal income tax purposes. Assuming a Non-U.S. Holder is not engaged in the conduct of a trade or business within the U.S., no U.S. federal income tax filings will generally be required solely on account of the cancellation of Ashtead Shares and the issue of Sunbelt Rentals Common Stock.
Non-U.S. Holders are encouraged to consult their tax advisers to determine the specific tax consequences to them of the Redomiciliation, including the effect of any U.S. federal, state, local, non-U.S. or other tax laws.
136
Table of Contents
Distributions
In general, any distributions made to a Non-U.S. Holder with respect to Sunbelt Rentals Common Stock, to the extent paid out of Sunbelt Rentals’ current or accumulated earnings and profits (as determined under U.S. federal income tax principles), will constitute dividends for U.S. federal income tax purposes and, provided such dividends are not effectively connected with such Non-U.S. Holder’s conduct of a trade or business within the U.S. (and, if required by an applicable income tax treaty, attributable to a U.S. permanent establishment or fixed base maintained by such Non-U.S. Holder), will be subject to U.S. federal withholding tax from the gross amount of the dividend at a rate of 30%, unless such Non-U.S. Holder is eligible for a reduced rate of withholding tax under an applicable income tax treaty and provides proper certification of its eligibility for such reduced rate (usually on an IRS Form W-8BEN or W-8BEN-E, as applicable). Any distribution not constituting a dividend will not be subject to U.S. federal withholding tax and will be treated first as reducing (but not below zero) the Non-U.S. Holder’s adjusted tax basis in its Sunbelt Rentals Common Stock and then, to the extent such distribution exceeds the Non-U.S. Holder’s adjusted tax basis, as gain realized from the sale or other disposition of such Sunbelt Rentals Common Stock.
Dividends paid by Sunbelt Rentals to a Non-U.S. Holder that are effectively connected with such Non-U.S. Holder’s conduct of a trade or business within the U.S. (and, if required by an applicable income tax treaty, attributable to a U.S. permanent establishment or fixed base maintained by such Non-U.S. Holder) will generally not be subject to U.S. federal withholding tax, provided such Non-U.S. Holder complies with certain certification and disclosure requirements (usually by providing an IRS Form W-8ECI). Instead, such dividends will generally be subject to U.S. federal income tax, net of certain deductions, at the same graduated individual or corporate rates applicable to U.S. Holders. If the Non-U.S. Holder is a corporation, dividends that are effectively connected income may also be subject to a “branch profits tax” at a rate of 30% (or such lower rate as may be specified by an applicable income tax treaty).
Gain on Sale, Taxable Exchange or Other Taxable Disposition
A Non-U.S. Holder will generally not be subject to U.S. federal income tax on gain realized on a sale or other disposition of Sunbelt Rentals Common Stock unless:
| • | such Non-U.S. Holder is an individual who was present in the U.S. for 183 days or more in the taxable year of such disposition and certain other requirements are met, in which case any gain realized will generally be subject to a flat 30% U.S. federal income tax; |
| • | the gain is effectively connected with a trade or business of such Non-U.S. Holder in the U.S. (and, if required by an applicable income tax treaty, attributable to a U.S. permanent establishment or fixed base maintained by such Non-U.S. Holder), in which case such gain will be subject to U.S. federal income tax, net of certain deductions, at the same graduated individual or corporate rates applicable to U.S. Holders, and any such gain of a Non-U.S. Holder that is a corporation may be subject to an additional “branch profits tax” at a rate of 30% (or such lower rate as may be specified by an applicable income tax treaty); or |
| • | Sunbelt Rentals Common Stock constitute U.S. real property interests (USRPIs) by reason of Sunbelt Rentals’ status as a U.S. real property holding corporation (USRPHC) for U.S. federal income tax purposes. |
With respect to the third bullet point above, although there can be no assurances in this regard, Sunbelt Rentals does not anticipate becoming a USRPHC. Because the determination of whether Sunbelt Rentals is a USRPHC depends on the fair market value of its USRPIs relative to the fair market value of its other business assets and its non-U.S. real property interests, however, there can be no assurance Sunbelt Rentals will not become a USRPHC in the future. Even if Sunbelt Rentals were to become a USRPHC, gain arising from the sale or other taxable disposition by a Non-U.S. Holder of Sunbelt Rentals Common Stock will not be subject to U.S. federal income tax if Sunbelt Rentals Common Stock are “regularly traded on an established securities market”
137
Table of Contents
(as defined by applicable Treasury Regulations), and such Non-U.S. Holder owned, actually and constructively, 5% or less of the total Sunbelt Rentals Common Stock issued and outstanding throughout the shorter of the five-year period ending on the date of the sale or other taxable disposition or the Non-U.S. Holder’s holding period. Non-U.S. Holders are encouraged to consult their tax advisors regarding the possible consequences to them if Sunbelt Rentals were to become a USRPHC.
Foreign Account Tax Compliance Act
Sections 1471 to 1474 of the Internal Revenue Code and the Treasury Regulations and administrative guidance promulgated thereunder (commonly referred as FATCA) generally impose withholding at a rate of 30% in certain circumstances on dividends in respect of securities (including Sunbelt Rentals Common Stock) which are held by or through certain foreign financial institutions (including investment funds), unless any such institution: (i) enters into, and complies with, an agreement with the IRS to report, on an annual basis, information with respect to interests in, and accounts maintained by, the institution that are owned by certain U.S. persons and by certain non-U.S. entities that are wholly or partially owned by U.S. persons and to withhold on certain payments; or (ii) if required under an intergovernmental agreement between the U.S. and an applicable foreign country, reports such information to its local tax authority, which will exchange such information with the U.S. authorities. An intergovernmental agreement between the U.S. and an applicable foreign country may modify these requirements. Accordingly, the entity through which Sunbelt Rentals Common Stock are held will affect the determination of whether such withholding is required. Similarly, dividends in respect of Sunbelt Rentals Common Stock held by an investor that is a non-financial non-U.S. entity that does not qualify under certain exceptions will generally be subject to withholding at a rate of 30%, unless such entity either: (i) certifies to the applicable withholding agent that such entity does not have any “substantial U.S. owners”; or (ii) provides certain information regarding the entity’s “substantial U.S. owners,” which will in turn be provided to the U.S. Treasury Department.
All holders should consult their tax advisors regarding the possible implications of FATCA on their investment in Sunbelt Rentals Common Stock.
U.S. Holders and Non-U.S. Holders are encouraged to consult their tax advisers to determine the specific tax consequences to them of holding and disposing of Sunbelt Rentals Common Stock, Including the effect of any U.S. federal, state, local, non-U.S. or other tax laws.
Material U.K. Tax Considerations
The following statements are intended only as a general guide to certain U.K. tax considerations and do not purport to be a complete analysis of all potential U.K. tax consequences of the Redomiciliation or of acquiring, holding or disposing of Sunbelt Rentals Common Stock. They are based on current U.K. law and what is understood to be the current practice of HMRC as at the date of this document, all of which may change, possibly with retroactive effect. They apply only to shareholders who are resident and, in the case of individuals domiciled, for tax purposes in (and only in) the United Kingdom (except insofar as express reference is made to the treatment of non-U.K. residents), who hold their Ashtead Shares as an investment (other than where a tax exemption applies, for example where the shares are held in an individual savings account or pension arrangement) and who are the absolute beneficial owners of both the shares and any dividends paid on them (U.K. Holders). The tax position of certain categories of Sunbelt Rentals stockholders who are subject to special rules is not considered and it should be noted that they may incur liabilities to U.K. tax on a different basis to that described below. This includes persons acquiring their shares in connection with employment, dealers in securities, insurance companies, collective investment schemes, charities, exempt pension funds, temporary non-residents and non-residents carrying on a trade, profession or vocation in the United Kingdom. The following statements do not purport to be a legal opinion.
138
Table of Contents
U.K. Holders and non-U.K. Holders who are in any doubt as to their tax position or who may be subject to tax in another jurisdiction should consult their professional advisors without delay.
Treatment of U.K. Holders as a result of the implementation of the Redomiciliation
Taxation of Income
The Redomiciliation should not be treated as involving a distribution subject to U.K. tax as income.
Taxation of Chargeable Gains
For the purposes of U.K. capital gains tax and corporation tax on chargeable gains (U.K. CGT), the cancellation of the Ashtead Shares and the issue of Sunbelt Rentals Common Stock should be treated as a scheme of reconstruction. Accordingly, Ashtead Shareholders should not be treated as making a disposal of all or part of their holding of Ashtead Shares and no liability to U.K. CGT should arise. Instead, the Sunbelt Rentals Common Stock acquired and the Ashtead Shares cancelled will, for U.K. CGT purposes, be treated as the same asset and as having been acquired at the same time as the Ashtead Shares.
If a shareholder alone, or together with persons connected with him or her, holds more than 5% of, or any class of, the shares in or debentures of Ashtead, such shareholder will be eligible for the above treatment only if the Redomiciliation is effected for bona fide commercial reasons and does not form part of a scheme or arrangement of which the main purpose, or one of the main purposes, is avoidance of liability to U.K. CGT. If these conditions are not met, then such shareholders will be treated as receiving Sunbelt Rentals Common Stock in consideration for the transfer of his or her Ashtead Shares which may, depending on the individual circumstances, give rise to a chargeable gain or allowable loss for U.K. CGT purposes. No application has been made to HMRC under Section 138 Taxation of Chargeable Gains Act 1992 for clearance that these conditions will be met. Any shareholder that is in any doubt as to its tax position should consult an appropriate tax advisor.
Transfer of Sunbelt Rentals Common Stock to Cede & Co. and issue of Sunbelt Rentals DIs
U.K. Holders holding Ashtead Shares in uncertificated form are not expected to be liable to U.K. CGT as a result of the transfer of the legal ownership of their Sunbelt Rentals Common Stock to Cede & Co. (in its capacity as nominee for the Depositary Trust Company (DTC)) and the receipt of Sunbelt Rentals DIs. This is on the basis that such transfers should not give rise (or should not be treated as giving rise) to a disposal of Sunbelt Rentals Common Stock, as the U.K. Holders will retain beneficial ownership of their Sunbelt Rentals Common Stock.
Income from Sunbelt Rentals Common Stock
Liability to U.K. tax on dividends will depend upon the individual circumstances of a Sunbelt Rentals stockholder.
Individual U.K. Holders
Dividend income received by U.K. Holders who are individuals will be subject to U.K. income tax. Under current U.K. tax rules specific rates of tax apply to dividend income. These include a nil rate of tax (the dividend allowance) for the first £500 of non-exempt dividend income in any tax year and different rates of tax for dividend income that exceeds the dividend allowance. For these purposes “dividend income” includes U.K. and non-U.K. source dividends and certain other distributions in respect of shares. For U.K. income tax purposes, the gross amount of the dividend paid before the deduction of U.S. withholding taxes (if applicable) must generally be brought into account.
139
Table of Contents
An individual U.K. Holder who receives a dividend from Sunbelt Rentals will not be liable to U.K. tax on the dividend to the extent that (taking account of any other non-exempt dividend income received by the shareholder in the same tax year) that dividend falls within the dividend allowance.
To the extent that (taking account of any other non-exempt dividend income received by the shareholder in the same tax year) the dividend exceeds the dividend allowance, it will be subject to income tax at 8.75% to the extent that it falls below the threshold for higher rate income tax. To the extent that (taking account of other non-exempt dividend income received by the shareholder in the same tax year) it falls above the threshold for higher rate income tax then the dividend will be taxed at 33.75% to the extent that it is within the higher rate band, or 39.35% to the extent that it is within the additional rate band. For the purposes of determining which of the taxable bands dividend income falls into, dividend income is treated as the highest part of a shareholder’s income. In addition, dividends within the dividend allowance which would (if there was no dividend allowance) have fallen within the basic or higher rate bands will use up those bands respectively for the purposes of determining whether the threshold for higher rate or additional rate income tax is exceeded.
As detailed in “—Material U.S. Federal Income Tax Considerations—U.S. Holders” above, dividends paid on the Sunbelt Rentals Common Stock to a U.K. Holder will generally be subject to U.S. federal withholding tax on the gross amount of the dividend at a rate of 30%, unless such U.K. Holder is eligible for a reduced rate of withholding tax under the U.K.-U.S. double taxation convention and provides proper certification of its eligibility for such reduced rate. U.K. Holders may be able to claim a partial or full credit for U.S. federal withholding tax withheld.
HMRC will generally give credit for any U.S. federal withholding tax withheld from a dividend paid by Sunbelt Rentals and not recoverable from the IRS against income tax payable by an individual U.K. Holder in respect of the dividend (having taken into account any benefits under the U.K.-U.S. double taxation convention). The amount of the credit will normally be equal to the lesser of: (i) the amount withheld in accordance with the convention once available double tax treaty claims have been made by the U.K. Holder to mitigate U.S. federal withholding tax suffered; and (ii) the liability to U.K. tax on the dividend.
Corporate U.K. Holders
It is likely that most dividends paid on the Sunbelt Rentals Common Stock to corporate U.K. Holders would fall within one or more of the classes of dividend qualifying for exemption from U.K. corporation tax under Part 9A Corporation Tax Act 2009. However, it should be noted that the exemptions are not comprehensive and are also subject to anti-avoidance rules.
As detailed above, under the dividend exemption rules of Part 9A Corporation Tax Act 2009, it is likely that any corporate U.K. Holder would not be subject to corporation tax on dividends paid by Sunbelt Rentals. On benefiting from the dividend exemption, no credit for any U.S. federal withholding tax withheld from a dividend paid by Sunbelt Rentals will be available to a corporate U.K. Holder.
However, under the dividend exemption rules an election can be made for a dividend to not be exempt from corporation tax. If such an election is made, HMRC will generally give credit for any U.S. federal withholding tax withheld from a dividend paid by Sunbelt Rentals and not recoverable from the IRS against the corporation tax payable by the corporate U.K. Holders in respect of the dividend. As with individual U.K. Holders, the amount of the credit will normally be equal to the lesser of: (i) the amount withheld in accordance with the convention once available double tax treaty claims have been made by the U.K. Holder to mitigate U.S. federal withholding tax suffered; and (ii) the liability to U.K. tax on the dividend.
If you are in any doubt about your tax position, you should consult your own professional advisor without delay.
140
Table of Contents
Disposal of Sunbelt Rentals Common Stock
A disposal or deemed disposal of Sunbelt Rentals Common Stock (including DTC book-entry interests and Sunbelt Rentals DIs) by a U.K. Holder may, depending upon the U.K. Holder’s circumstances and subject to any available exemption or relief (such as the annual exempt amount for individuals), give rise to a chargeable gain or an allowable loss for the purposes of U.K. CGT.
U.K. stamp duty and SDRT
Implementation of the Redomiciliation
No U.K. stamp duty or Stamp Duty Reserve Tax (SDRT) should be payable in respect of the cancellation of Ashtead Shares and the issue of Sunbelt Rentals Common Stock under the Redomiciliation, or in respect of the transfer of Sunbelt Rentals Common Stock to Cede & Co as nominee for the DTC and the issue of Sunbelt Rentals DIs.
Transfers of Sunbelt Rentals Common Stock
No U.K. stamp duty should be payable on transfers of Sunbelt Rentals Common Stock (whether held through DTC or directly through DRS), provided that any written instrument of transfer is executed and retained outside of the United Kingdom and does not relate to any property situated in the United Kingdom or to any matter or thing to be done in the United Kingdom.
No U.K. SDRT will be payable in respect of any agreement to transfer Sunbelt Rentals Common Stock (whether held through DTC or directly through DRS) on the assumption that the Sunbelt Rentals Common Stock will not be registered in a register kept in the United Kingdom by or on behalf of Sunbelt Rentals.
Transfers of Sunbelt Rentals DIs
No U.K. stamp duty will arise on transfers of Sunbelt Rentals DIs provided that no written instrument of transfer is used to effect such a transfer.
No U.K. SDRT will arise on transfers of Sunbelt Rentals DIs, provided that (i) the Sunbelt Rentals Common Stock represented by the Sunbelt Rentals DIs are of the same class as shares in Sunbelt Rentals Common Stock that are listed on a ‘recognised stock exchange’ for U.K. tax purposes, (ii) the Sunbelt Rentals Common Stock are not registered in a register that is kept in the U.K., and (iii) Sunbelt Rentals (as a non-U.K. incorporated company) remains centrally managed and controlled outside the U.K. Sunbelt Rentals Common Stock that are included in the Official List and admitted to trading on the LSE’s main market, and/or officially listed in the United States and admitted to trading on the NYSE, are regarded as listed on a recognised stock exchange for U.K. tax purposes.
Inheritance Tax
From April 6, 2025, liability to U.K. inheritance tax may arise in respect of Sunbelt Rentals Common Stock on the death of, or on a gift of Sunbelt Rentals Common Stock by, an individual Sunbelt Rentals stockholder who is a “long-term U.K. resident” for the purposes of the Inheritance Tax Act 1984. Subject to certain exceptions, an individual will be “long-term U.K. resident” if they have been U.K. resident for at least 10 of the previous 20 tax years.
The Sunbelt Rentals Common Stock, if held directly, rather than as Sunbelt Rentals DIs, should not be assets situated in the U.K. for the purposes of U.K. inheritance tax. Accordingly, neither the death of a Sunbelt Rentals stockholder nor a gift of such Sunbelt Rentals Common Stock by a Sunbelt Rentals stockholder should give rise to a liability to U.K. inheritance tax if the Sunbelt Rentals stockholder is not a “long-term U.K.
141
Table of Contents
resident”. However, Sunbelt Rentals DIs may be treated as assets situated in the U.K. for the purposes of U.K. inheritance tax. Accordingly, the death of a holder of Sunbelt Rentals DIs or a gift of Sunbelt Rentals DIs by a holder may give rise to a liability to U.K. inheritance tax, even if the holder is not a “long-term U.K. resident”.
For inheritance tax purposes, a transfer of assets at less than full market value may be treated as a gift and particular rules apply to gifts where the donor reserves or retains some benefit. Special rules also apply to close companies and to trustees of settlements who hold Sunbelt Rentals Common Stock, bringing them within the charge to inheritance tax.
Stockholders should consult an appropriate tax advisor if they make a gift or transfer at less than full market value or if they intend to hold any Sunbelt Rentals Common Stock or Sunbelt Rentals DIs through trust arrangements.
| Item 12. | Indemnification of Directors and Officers. |
Our certificate of incorporation provides that, to the fullest extent provided from time to time by Delaware law, the Company (a) shall indemnify its directors and officers against judgments, fines, penalties, amounts paid in settlement and expenses incurred by them in connection with actions, suits, proceedings or claims arising out of their service to the Company and, upon receipt of certain undertakings, shall advance expenses to them in connection with such matters and (b) may maintain insurance or make other financial arrangements on behalf of its directors and officers for any liability and expenses incurred by them, whether or not we have authority to indemnify them against such liability and expenses.
We maintain directors’ and officers’ liability insurance insuring our directors and executive officers against certain liabilities arising out of their service as such.
Additionally, prior to the effectiveness of this Registration Statement, we intend to enter into separate indemnification agreements with each of our directors and executive officers, pursuant to which each director or executive officer will be entitled to indemnification in certain circumstances against liability which they may incur in their capacity as a director or officer. See the Form of Indemnification Agreement, Exhibit 10.22 of this Registration Statement.
| Item 13. | Financial Statements and Supplementary Data. |
See the consolidated financial statements and notes beginning on page F-1 of this Registration Statement.
| Item 14. | Changes in and Disagreements with Accountants on Accounting and Financial Disclosure. |
Following a formal audit tender process, Ashtead concluded an audit tender for Ashtead’s external audit provider pursuant to which the audit committee of Ashtead recommended, and the Board of Directors endorsed, the appointment of PricewaterhouseCoopers LLP (PwC) as the Company’s external auditor. The appointment of PwC was approved by Ashtead Shareholders at Ashtead’s 2023 annual general meeting. On September 7, 2023, Ashtead announced that Deloitte LLP (Deloitte) had resigned as Ashtead’s external audit provider.
Deloitte’s audit report on the financial statements of Ashtead as of and for the fiscal year ended April 30, 2023 contained no adverse opinion or disclaimer of opinion, and was not qualified or modified as to uncertainty, audit scope or accounting principles.
During the fiscal year ended April 30, 2023 and in the subsequent interim period through September 6, 2023, there were (i) no “disagreements” (as that term is used in Item 304(a)(1)(iv) of Regulation S-K and the related instructions to Item 304 of Regulation S-K) with Deloitte on any matter of accounting principles or practices, financial statement disclosure or auditing scope or procedures, which disagreements, if not resolved to the satisfaction of Deloitte, would have caused Deloitte to make reference to the subject matter of the disagreements in connection with the audit reports it issued during such period, and (ii) no “reportable events,” as that term is described in Item 304(a)(1)(v) and the related instructions to Item 304 of Regulation S-K.
142
Table of Contents
Deloitte was reengaged to audit the consolidated financial statements of Ashtead as of and for the fiscal year ended April 30, 2023 in accordance with PCAOB standards on May 1, 2025 and completed its PCAOB audit on September 5, 2025. During the fiscal year ended April 30, 2023, and in the subsequent period May 1, 2025 through September 5, 2025, there were (i) no “disagreements” (as that term is used in Item 304(a)(1)(iv) of Regulation S-K and the related instructions to Item 304 of Regulation S-K) with Deloitte on any matter of accounting principles or practices, financial statement disclosure or auditing scope or procedures, which disagreements, if not resolved to the satisfaction of Deloitte, would have caused them to make reference to the subject matter of the disagreements in their audit reports, and (ii) no “reportable events,” as such term is described in Item 304(a)(1)(v) and the related instructions to Item 304 of Regulation S-K.
We have provided Deloitte with a copy of the foregoing disclosure and has requested that Deloitte furnish the Company with a letter addressed to the SEC stating whether Deloitte agrees with the statements contained herein and, if not, stating the respects in which they do not agree. A copy of Deloitte’s letter, dated September 5, 2025, is included as Exhibit 16.1 to this Registration Statement.
During the fiscal year ended April 30, 2023 and in the subsequent interim period through September 6, 2023, neither we, nor anyone acting on our behalf, consulted with PwC regarding either (i) the application of accounting principles to a specified transaction, either completed or proposed, the type of audit opinion that might be rendered on our financial statements, or (ii) any other matter that was the subject of a “disagreement” as that term is used in Item 304(a)(1)(iv) of Regulation S-K and the related instructions to Item 304 of Regulation S-K or a “reportable event” as that term is used in Item 304(a)(1)(v) and the related instructions to Item 304 of Regulation S-K.
| Item 15. | Financial Statements and Exhibits. |
| (a) | List separately all financial statements filed as part of the Registration Statement. |
The financial statements are included beginning on page F-1 of this Registration Statement.
| (b) | Exhibits. The following are furnished as exhibits hereto: |
143
Table of Contents
| # | Indicates management contract or compensatory plan. |
144
Table of Contents
SIGNATURES
Pursuant to the requirements of Section 12 of the Securities Exchange Act of 1934, the registrant has duly caused this Registration Statement to be signed on its behalf by the undersigned, thereunto duly authorized.
| SUNBELT RENTALS HOLDINGS, INC. | ||
| By: |
/s/ Brendan Horgan | |
| Name: |
Brendan Horgan | |
| Title: |
Chief Executive Officer | |
145
Table of Contents
Condensed Consolidated Financial Statements
As of October 31, 2025 and April 30, 2025 and for the Six Months Ended
October 31, 2025 and 2024
(Unaudited)
| Page | ||||
| F-3 | ||||
| F-4 | ||||
| Unaudited Condensed Consolidated Statements of Comprehensive Income |
F-5 | |||
| Unaudited Condensed Consolidated Statements of Stockholders’ Equity |
F-6 | |||
| F-7 | ||||
| Notes to the Unaudited Condensed Consolidated Financial Statements |
F-8 | |||
| Consolidated Financial Statements As of and for the Years Ended April 30, 2025, 2024 and 2023 |
| |||
| F-19 | ||||
| F-22 | ||||
| F-23 | ||||
| F-24 | ||||
| F-25 | ||||
| F-26 | ||||
| F-27 | ||||
F-1
Table of Contents
Table of Contents
Ashtead Group plc
Condensed Consolidated Balance Sheets
(in millions, except par value and share amounts)
| October 31, 2025 (Unaudited) |
April 30, 2025 |
|||||||
| ASSETS |
||||||||
| Cash and cash equivalents |
$ | 40 | $ | 21 | ||||
| Accounts receivable, net of allowance for credit losses of $111 and $102, respectively |
1,755 | 1,481 | ||||||
| Inventory |
156 | 147 | ||||||
| Prepaid expenses and other assets |
425 | 372 | ||||||
|
|
|
|
|
|||||
| Total current assets |
2,376 | 2,021 | ||||||
|
|
|
|
|
|||||
| Rental equipment, net |
11,302 | 11,340 | ||||||
| Property and equipment, net |
2,058 | 2,038 | ||||||
| Goodwill |
3,401 | 3,348 | ||||||
| Other intangible assets, net |
391 | 433 | ||||||
| Operating lease right-of-use assets |
2,563 | 2,523 | ||||||
| Other long-term assets |
264 | 267 | ||||||
|
|
|
|
|
|||||
| Total non-current assets |
19,979 | 19,949 | ||||||
|
|
|
|
|
|||||
| Total assets |
$ | 22,355 | $ | 21,970 | ||||
|
|
|
|
|
|||||
| LIABILITIES AND STOCKHOLDERS’ EQUITY |
||||||||
| Accounts payable |
$ | 510 | $ | 302 | ||||
| Accrued expenses and other liabilities |
1,079 | 991 | ||||||
| Operating lease liabilities |
275 | 266 | ||||||
|
|
|
|
|
|||||
| Total current liabilities |
1,864 | 1,559 | ||||||
|
|
|
|
|
|||||
| Long-term debt |
7,680 | 7,500 | ||||||
| Deferred taxes |
2,357 | 2,288 | ||||||
| Non-current portion of operating lease liabilities |
2,479 | 2,434 | ||||||
| Other long-term liabilities |
411 | 390 | ||||||
|
|
|
|
|
|||||
| Total non-current liabilities |
12,927 | 12,612 | ||||||
|
|
|
|
|
|||||
| Total liabilities |
14,791 | 14,171 | ||||||
|
|
|
|
|
|||||
| Commitments and contingencies (Note 9) |
||||||||
| Stockholders’ equity: |
||||||||
| Common stock – £0.10 par value, 451,354,833 and 420,020,433 shares issued and outstanding, respectively, as of October 31, 2025, 451,354,833 and 430,708,216 shares issued and outstanding, respectively, as of April 30, 2025 |
82 | 82 | ||||||
| Additional paid-in capital |
46 | 46 | ||||||
| Retained earnings |
9,605 | 9,103 | ||||||
| Treasury stock at cost – 30,970,321 and 20,111,957 shares as of October 31, 2025 and April 30, 2025, respectively |
(1,887 | ) | (1,171 | ) | ||||
| Common stock held by the ESOT – 364,079 and 534,660 shares as of October 31, 2025 and April 30, 2025, respectively |
(23 | ) | (35 | ) | ||||
| Accumulated other comprehensive loss |
(259 | ) | (226 | ) | ||||
|
|
|
|
|
|||||
| Total stockholders’ equity |
7,564 | 7,799 | ||||||
|
|
|
|
|
|||||
| Total liabilities and stockholders’ equity |
$ | 22,355 | $ | 21,970 | ||||
|
|
|
|
|
|||||
See accompanying notes to the condensed consolidated financial statements.
F-3
Table of Contents
Ashtead Group plc
Condensed Consolidated Statements of Income
(in millions, except per share amounts)
(Unaudited)
| Six Months Ended October 31, | ||||||||
| 2025 | 2024 | |||||||
| Revenues: |
||||||||
| Equipment rentals |
$ | 5,357 | $ | 5,265 | ||||
| Sales of rental equipment |
211 | 248 | ||||||
| Sales of new equipment, merchandise and consumables |
195 | 182 | ||||||
|
|
|
|
|
|||||
| Total revenues |
5,763 | 5,695 | ||||||
| Cost of revenues: |
||||||||
| Cost of equipment rentals, excluding depreciation |
2,199 | 2,079 | ||||||
| Depreciation of rental equipment |
925 | 902 | ||||||
| Cost of rental equipment sales |
191 | 212 | ||||||
| Cost of sales of new equipment, merchandise and consumables |
120 | 107 | ||||||
|
|
|
|
|
|||||
| Total cost of revenues |
3,435 | 3,300 | ||||||
|
|
|
|
|
|||||
| Gross profit |
2,328 | 2,395 | ||||||
|
|
|
|
|
|||||
| Selling, general and administrative expenses |
819 | 730 | ||||||
| Non-rental depreciation and amortization |
230 | 214 | ||||||
|
|
|
|
|
|||||
| Operating income |
1,279 | 1,451 | ||||||
| Interest expense, net |
193 | 222 | ||||||
| Other (income) expense, net |
(5 | ) | 16 | |||||
|
|
|
|
|
|||||
| Income before provision for income taxes |
1,091 | 1,213 | ||||||
| Provision for income taxes |
282 | 314 | ||||||
|
|
|
|
|
|||||
| Net income |
$ | 809 | $ | 899 | ||||
|
|
|
|
|
|||||
| Basic earnings per share |
1.90 | 2.06 | ||||||
| Diluted earnings per share |
1.90 | 2.05 | ||||||
See accompanying notes to the condensed consolidated financial statements.
F-4
Table of Contents
Ashtead Group plc
Condensed Consolidated Statements of Comprehensive Income
(in millions)
(Unaudited)
| Six Months Ended October 31, | ||||||||
| 2025 | 2024 | |||||||
| Net income |
$ | 809 | $ | 899 | ||||
| Other comprehensive (loss) income, net of tax : |
||||||||
| Foreign currency translation adjustments(1) |
(33 | ) | 9 | |||||
|
|
|
|
|
|||||
| Other comprehensive (loss) income |
(33 | ) | 9 | |||||
|
|
|
|
|
|||||
| Total comprehensive income |
$ | 776 | $ | 908 | ||||
|
|
|
|
|
|||||
| (1) | There was no material tax impact related to the foreign currency translation adjustments during the six months ended October 31, 2024 and 2025. |
See accompanying notes to the condensed consolidated financial statements.
F-5
Table of Contents
Ashtead Group plc
Condensed Consolidated Statements of Stockholders’ Equity
(in millions, except per share and share amounts)
(Unaudited)
| Common Stock | Additional Paid-in Capital |
Retained Earnings |
Treasury Stock | Common stock held by the ESOT |
Accumulated Other Comprehensive Loss |
Total Stockholders’ Equity |
||||||||||||||||||||||||||||||||||
| Number of Shares |
Amount | Number of Shares |
Amount | Number of Shares |
Amount | |||||||||||||||||||||||||||||||||||
| Balance as of May 1, 2025 |
451,354,833 | $ | 82 | $ | 46 | $ | 9,103 | 20,111,957 | $ | (1,171 | ) | 534,660 | $ | (35 | ) | $ | (226 | ) | $ | 7,799 | ||||||||||||||||||||
| Net income |
809 | 809 | ||||||||||||||||||||||||||||||||||||||
| Foreign currency translation adjustments |
(33 | ) | (33 | ) | ||||||||||||||||||||||||||||||||||||
| Loss on cash flow hedge |
||||||||||||||||||||||||||||||||||||||||
| Dividends, $0.72 per share |
(305 | ) | (305 | ) | ||||||||||||||||||||||||||||||||||||
| Stock based compensation |
(2 | ) | 31 | 29 | ||||||||||||||||||||||||||||||||||||
| Repurchase of common stock |
10,858,364 | (716 | ) | (170,581 | ) | (19 | ) | (735 | ) | |||||||||||||||||||||||||||||||
|
|
|
|
|
|
|
|
|
|
|
|
|
|
|
|
|
|
|
|
|
|||||||||||||||||||||
| Balance as of October 31, 2025 |
451,354,833 | $ | 82 | $ | 46 | $ | 9,605 | 30,970,321 | $ | (1,887 | ) | 364,079 | $ | (23 | ) | $ | (259 | ) | $ | 7,564 | ||||||||||||||||||||
|
|
|
|
|
|
|
|
|
|
|
|
|
|
|
|
|
|
|
|
|
|||||||||||||||||||||
| Common Stock | Additional Paid-in Capital |
Retained Earnings |
Treasury Stock | Common stock held by the ESOT |
Accumulated Other Comprehensive Loss |
Total Stockholders’ Equity |
||||||||||||||||||||||||||||||||||
| Number of Shares |
Amount | Number of Shares |
Amount | Number of Shares |
Amount | |||||||||||||||||||||||||||||||||||
| Balance as of May 1, 2024 |
451,354,833 | $ | 82 | $ | 37 | $ | 8,084 | 14,056,026 | $ | (819 | ) | 853,869 | $ | (44 | ) | $ | (280 | ) | $ | 7,060 | ||||||||||||||||||||
| Net income |
899 | 899 | ||||||||||||||||||||||||||||||||||||||
| Foreign currency translation adjustments |
9 | 9 | ||||||||||||||||||||||||||||||||||||||
| Dividends, $0.89 per share |
(390 | ) | (390 | ) | ||||||||||||||||||||||||||||||||||||
| Stock based compensation |
(5 | ) | 10 | 94 | 99 | |||||||||||||||||||||||||||||||||||
| Repurchase of common stock |
(315,575 | ) | (85 | ) | (85 | ) | ||||||||||||||||||||||||||||||||||
|
|
|
|
|
|
|
|
|
|
|
|
|
|
|
|
|
|
|
|
|
|||||||||||||||||||||
| Balance as of October 31, 2024 |
451,354,833 | $ | 82 | $ | 32 | $ | 8,603 | 14,056,026 | $ | (819 | ) | 538,294 | $ | (35 | ) | $ | (271 | ) | $ | 7,592 | ||||||||||||||||||||
|
|
|
|
|
|
|
|
|
|
|
|
|
|
|
|
|
|
|
|
|
|||||||||||||||||||||
See accompanying notes to the condensed consolidated financial statements.
F-6
Table of Contents
Ashtead Group plc
Condensed Consolidated Statements of Cash Flows
(in millions)
(Unaudited)
| Six Months Ended October 31, | ||||||||
| 2025 | 2024 | |||||||
| Cash flows from operating activities: |
||||||||
| Net income |
$ | 809 | $ | 899 | ||||
| Adjustments to reconcile net income to net cash provided by operating activities: |
||||||||
| Depreciation and amortization |
1,155 | 1,116 | ||||||
| Gain on sales of rental equipment |
(20 | ) | (36 | ) | ||||
| Gain on sales of non-rental equipment |
(3 | ) | (9 | ) | ||||
| Deferred tax expense |
69 | 26 | ||||||
| Operating lease expense |
154 | 142 | ||||||
| Stock based compensation expense |
34 | 3 | ||||||
| Provision for receivable allowances |
31 | 28 | ||||||
| Other |
5 | 31 | ||||||
| Changes in operating assets and liabilities, net of amounts acquired: |
||||||||
| Increase in accounts receivable |
(286 | ) | (183 | ) | ||||
| (Increase) decrease in inventory |
(7 | ) | 1 | |||||
| Increase in prepaid expenses and other assets |
(52 | ) | (31 | ) | ||||
| Increase in accounts payable |
39 | 36 | ||||||
| Decrease in operating lease liabilities |
(141 | ) | (132 | ) | ||||
| Increase in accrued expenses and other liabilities |
78 | 47 | ||||||
|
|
|
|
|
|||||
| Net cash provided by operating activities |
$ | 1,865 | $ | 1,938 | ||||
|
|
|
|
|
|||||
| Cash flows from investing activities |
||||||||
| Payments for acquisition of businesses, net of cash acquired |
(123 | ) | (53 | ) | ||||
| Proceeds from disposal of business |
16 | — | ||||||
| Payments for purchases of rental equipment |
(872 | ) | (1,518 | ) | ||||
| Payments for non-rental property and equipment |
(197 | ) | (298 | ) | ||||
| Proceeds from sales of rental equipment |
194 | 215 | ||||||
| Proceeds from disposal of non-rental property and equipment |
23 | 30 | ||||||
| Payments for purchases of intangibles |
(3 | ) | (8 | ) | ||||
|
|
|
|
|
|||||
| Net cash used in investing activities |
$ | (962 | ) | $ | (1,632 | ) | ||
|
|
|
|
|
|||||
| Cash flows from financing activities |
||||||||
| Proceeds from debt |
906 | 840 | ||||||
| Payments of debt |
(741 | ) | (657 | ) | ||||
| Repayments of principal under finance lease liabilities |
(9 | ) | (8 | ) | ||||
| Payment of contingent consideration |
— | (6 | ) | |||||
| Dividends paid |
(307 | ) | (387 | ) | ||||
| Common stock repurchased by the ESOT, including tax on stock based compensation |
(19 | ) | (85 | ) | ||||
| Common stock repurchased by the Company, including tax on stock based compensation |
(714 | ) | — | |||||
|
|
|
|
|
|||||
| Net cash used in financing activities |
$ | (884 | ) | $ | (303 | ) | ||
|
|
|
|
|
|||||
| Effect of exchange rate changes on cash and cash equivalents |
— | — | ||||||
|
|
|
|
|
|||||
| Net increase in cash and cash equivalents |
19 | 3 | ||||||
| Cash and cash equivalents at the beginning of period |
21 | 21 | ||||||
|
|
|
|
|
|||||
| Cash and cash equivalents at the end of period |
$ | 40 | $ | 24 | ||||
|
|
|
|
|
|||||
| Supplemental disclosure of cash flow information: |
||||||||
| Cash paid for interest |
$ | 182 | $ | 220 | ||||
| Cash paid for income taxes, net |
$ | 230 | $ | 256 | ||||
See accompanying notes to the condensed consolidated financial statements.
F-7
Table of Contents
Ashtead Group plc
Notes to Condensed Consolidated Financial Statements
(Unaudited)
1. Organization and Description of Business
Ashtead Group plc (“the Company”) is an international equipment rental company, incorporated in England and Wales, with national networks in the United States (“U.S.”), Canada and the United Kingdom (“UK”), trading under the Sunbelt Rentals brand. As used in this report, the terms the “Company,” and “Ashtead,” refer to Ashtead Group plc and its subsidiaries, unless otherwise indicated.
The Company rents a broad range of construction, industrial, general and specialty equipment across a wide variety of applications to a diverse customer base.
2. Basis of Presentation and Significant Accounting Policies
Basis of Presentation and Principles of Consolidation
The accompanying unaudited consolidated financial statements have been prepared in conformity with accounting principles generally accepted in the United States (“U.S. GAAP”) and pursuant to the rules and regulations of the Securities and Exchange Commission (“SEC”) regarding interim financial information. Certain information and note disclosures normally included in the consolidated financial statements prepared in accordance with U.S. GAAP have been condensed or omitted pursuant to such rules and regulations. As such, the information included in the accompanying unaudited condensed consolidated financial statements should be read in conjunction with the audited consolidated financial statements and the related notes thereto as of and for the fiscal year ended April 30, 2025, included elsewhere in this Form 10.
In the opinion of the Company, the accompanying unaudited condensed consolidated financial statements reflect all adjustments, consisting of normal recurring adjustments, which are necessary for a fair statement of its condensed consolidated balance sheet as of October 31, 2025 and condensed consolidated statements of income and cash flows for the six months ended October 31, 2025 and 2024. The results for the interim periods are not necessarily indicative of results for the full fiscal year.
Use of Estimates
The preparation of financial statements in conformity with U.S. GAAP requires management to make estimates and assumptions that affect the amounts reported in the financial statements and accompanying notes. Significant items subject to such estimates include, but are not limited to, allowance for credit losses, depreciation and amortization, income taxes and reserves for claims. Actual results could materially differ from those estimates.
New Accounting Pronouncements Issued but not yet adopted
Expense Disaggregation Disclosure. In November 2024, the FASB issued Accounting Standards Update No. 2024-03, “Income Statement – Reporting Comprehensive Income – Expense Disaggregation Disclosures (Subtopic 220-40)” (“ASU 2024-03”), which improves the disclosures about a public business entity’s expenses and addresses requests from investors for more detailed information about the types of expenses in commonly presented expense captions such as cost of sales, SG&A, and research and development. This ASU is effective for fiscal years beginning after December 15, 2026 and early adoption is permitted. The amendments in this ASU can be applied prospectively or retrospectively. The Company is evaluating the effect of adopting this new accounting guidance.
Credit Losses. In July 2025, the FASB issued Accounting Standards Update No. 2025-05, “Financial Instruments – Credit Losses: Measurement of Credit Losses for Accounts Receivable and Contract Assets” (“ASU 2025-05”),
F-8
Table of Contents
Ashtead Group plc
Notes to Condensed Consolidated Financial Statements
(Unaudited)
which provides optional guidance relating to the estimation of expected credit losses on current accounts receivable and current contract assets. This guidance permits entities to apply a practical expedient that assumes current conditions as of the balance sheet date do not change for the remaining life of the asset. ASU 2025-05 is effective for annual reporting periods beginning after December 15, 2025, and interim reporting periods within those annual reporting periods, with early adoption permitted. The guidance should be applied prospectively. The Company is currently assessing the impact this guidance will have on its financial statements.
Internal Use Software. In September 2025, the FASB issued Accounting Standards Update No. 2025-06, Intangibles – Goodwill and Other – Internal-Use Software (Subtopic 350-40): Targeted Improvements to the Accounting for Internal-Use Software (“ASU 2025-06”), which modernizes the accounting for internal-use software costs by increasing the operability of the recognition guidance considering different methods of software development. This ASU is effective for fiscal years beginning after December 15, 2027 and early adoption is permitted. The amendments in this ASU can be applied prospectively, retrospectively, or with a modified transition approach. The Company is evaluating the effect of adopting this new accounting guidance.
Interim Reporting. In December 2025, the FASB issued Accounting Standards Update No. 2025-11, Interim Reporting (Topic 270) Narrow-Scope Improvements (“ASU 2025-11”) to improve the guidance in Topic 270, Interim Reporting, by improving the navigability of the required interim disclosures and clarifying when that guidance is applicable. This ASU is effective for interim reporting periods within annual reporting periods beginning after December 15, 2027 and early adoption is permitted. The amendments in this ASU can be applied prospectively or retrospectively. The Company is evaluating the effect of adopting this new accounting guidance.
Accounting for Government Grants. In December 2025, the FASB issued Accounting Standards Update No. 2025-10, Government Grants (Topic 832): Accounting for Government Grants Received by Business Entities (“ASU 2025-10”) to establish authoritative guidance in U.S. GAAP for the recognition, measurement, presentation and disclosure of government grants received by for-profit entities. The guidance is effective for fiscal years beginning after December 15, 2028, including interim periods within those fiscal years. Early adoption is permitted as of the beginning of an annual reporting period. ASU 2025-10 should be applied utilizing a retrospective approach, or utilizing a modified transition approach. The Company is evaluating the effect of adopting this new accounting guidance.
3. Revenue Recognition
Nature of goods and services
In the following table, revenue is summarized by type and by the applicable accounting standard.
| For the Six Months Ended October 31, | ||||||||||||||||||||||||
| 2025 | 2024 | |||||||||||||||||||||||
| (in millions) |
Topic 842 |
Topic 606 |
Total | Topic 842 |
Topic 606 |
Total | ||||||||||||||||||
| Revenues: |
||||||||||||||||||||||||
| Equipment rentals |
$ | 4,330 | $ | — | $ | 4,330 | $ | 4,249 | $ | — | $ | 4,249 | ||||||||||||
| Other rental revenue: |
||||||||||||||||||||||||
| Delivery and pick-up |
— | 465 | 465 | — | 469 | 469 | ||||||||||||||||||
| Other |
185 | 377 | 562 | 183 | 364 | 547 | ||||||||||||||||||
|
|
|
|
|
|
|
|
|
|
|
|
|
|||||||||||||
| Total equipment rentals |
4,515 | 842 | 5,357 | 4,432 | 833 | 5,265 | ||||||||||||||||||
| Sales of rental equipment |
— | 211 | 211 | — | 248 | 248 | ||||||||||||||||||
| Sales of new equipment, merchandise and consumables |
— | 195 | 195 | — | 182 | 182 | ||||||||||||||||||
|
|
|
|
|
|
|
|
|
|
|
|
|
|||||||||||||
| Total revenues |
$ | 4,515 | $ | 1,248 | $ | 5,763 | $ | 4,432 | $ | 1,263 | $ | 5,695 | ||||||||||||
|
|
|
|
|
|
|
|
|
|
|
|
|
|||||||||||||
F-9
Table of Contents
Ashtead Group plc
Notes to Condensed Consolidated Financial Statements
(Unaudited)
Allowance for Credit Losses
The rollforward of the allowance for credit losses is shown below.
| Six Months Ended October 31, |
||||||||
| (in millions) |
2025 | 2024 | ||||||
| Beginning balance |
$ | 102 | $ | 141 | ||||
| Amounts written off or recovered |
(22 | ) | (18 | ) | ||||
| Increase in allowance recognized |
31 | 28 | ||||||
|
|
|
|
|
|||||
| Ending balance |
$ | 111 | $ | 151 | ||||
|
|
|
|
|
|||||
4. Acquisitions
The Company undertakes bolt-on acquisitions to complement its organic growth strategy.
During the six months ended October 31, 2025, the Company completed several acquisitions that were individually immaterial. The aggregate consideration for the acquisitions was $135 million. The following table summarizes the estimated fair values of the assets acquired and liabilities assumed. The purchase price allocations for these assets and liabilities are based on preliminary valuations and are subject to change as we obtain additional information during the acquisition measurement period, although we do not expect material future changes.
| (in millions) |
Total | |||
| Accounts receivables |
$ | 9 | ||
| Inventory |
2 | |||
| Rental equipment |
55 | |||
| Property and equipment |
4 | |||
| Operating lease right-of-use assets |
16 | |||
| Intangible assets |
24 | |||
|
|
|
|||
| Total identifiable assets acquired |
110 | |||
|
|
|
|||
| Accounts payable, accrued expenses and other liabilities |
(10 | ) | ||
| Operating lease liabilities |
(16 | ) | ||
| Long-term debt |
(19 | ) | ||
|
|
|
|||
| Total liabilities assumed |
(45 | ) | ||
|
|
|
|||
| Net identifiable assets acquired |
65 | |||
| Goodwill |
70 | |||
|
|
|
|||
| Net assets acquired |
$ | 135 | ||
|
|
|
|||
The following table reflects the fair values and useful lives of the acquired intangible assets identified based on the purchase accounting assessments:
| (in millions) |
Fair value | Life (years) | ||||||
| Customer lists |
$ | 23 | 8 | |||||
| Software |
1 | 7 | ||||||
|
|
|
|||||||
| Total |
24 | |||||||
F-10
Table of Contents
Ashtead Group plc
Notes to Condensed Consolidated Financial Statements
(Unaudited)
The goodwill arising can be attributed to the key management personnel and workforce of the acquired businesses, the benefits through advancing the clusters and leveraging cross-selling opportunities, and to the synergies and other benefits the Company expects to derive from the acquisitions. The synergies and other benefits include elimination of duplicate costs, improving utilization of the acquired rental fleet, using the Company’s financial strength to invest in the acquired business and drive improved returns through a semi-fixed cost base and the application of the Company’s proprietary software to optimize revenue opportunities. $35 million of the goodwill is expected to be deductible for income tax purposes.
Due to the operational integration of acquired businesses post-acquisition, in particular due to the merger of some stores, the movement of rental equipment between stores and investment in the rental fleet, it is not practical to report the revenue and profit of the acquired businesses post-acquisition. The revenue and net income of these acquisitions from May 1, 2024 to their date of acquisition was not material.
5. Segment Information
The Company operates with the following three reportable and operating segments: North America – General Tool, North America – Specialty and UK, which are consistent with how the Company’s chief operating decision maker (CODM) assesses performance and allocates resources. The operating segments are determined primarily based on the nature of the products and services and the management structure of the Company. The Company’s CODM has been identified as its chief executive officer.
North America – General Tool
The North America – General Tool segment includes the rental of general construction and industrial equipment such as mobile elevating platforms, forklifts, earth moving equipment and general tool and light equipment. The segment operates predominantly across the U.S. and Canada.
North America – Specialty
The North America – Specialty segment focus on products with comparatively low rental penetration including Power & HVAC, Scaffold, Pump, Film & TV and Climate Control. The Specialty products and services are often a natural add-on to the General Tool products and services. The segment operates across the U.S. and Canada.
UK
The UK segment operates predominantly in the UK and rents a broad range of construction, industrial, general and specialty equipment.
The Company manages debt, its lease portfolio and taxation centrally, rather than by operating segments. Accordingly, segmental costs are stated excluding the impact of ASC 842 lease accounting in relation to the Company’s property leases and non-recurring restructuring charges. Furthermore, segment results are stated before interest and taxation which are reported as central Company items. This is consistent with the way the chief executive reviews the business.
Segment performance and resource allocation are evaluated by the CODM using adjusted segment operating profit. The CODM is the primary individual in control of resource allocation. The most significant allocation determinations made by the CODM using the adjusted segment operating profit relates to purchases of rental equipment, and these determinations are generally made as part of the annual budgeting process, with regular financial and operational performance reviews occurring throughout the year that can result in allocation changes (for example, if a specific segment outperforms its plan, that could result in a reallocation of resources between segments or an increase in the total allocated resources).
F-11
Table of Contents
Ashtead Group plc
Notes to Condensed Consolidated Financial Statements
(Unaudited)
There are no material sales between the reportable segments. Capital expenditure represents additions to rental equipment, property and equipment, and includes additions through the acquisition of businesses. Segment assets exclude corporate assets, such as cash and cash equivalents, corporate facilities, goodwill, and other intangible assets, and tax assets.
The following table sets forth financial information by segment for the six months ended October 31, 2025 and 2024 and as of October 31, 2025 and April 30, 2025:
| North America | ||||||||||||||||
| (in millions) |
General Tool | Specialty | UK | Total | ||||||||||||
| Six months ended October 31, 2025 |
||||||||||||||||
| Equipment rentals |
$ | 3,165 | $ | 1,770 | $ | 422 | $ | 5,357 | ||||||||
| Sales of rental equipment |
146 | 44 | 21 | 211 | ||||||||||||
| Sales of new equipment, merchandise and consumables |
88 | 66 | 41 | 195 | ||||||||||||
|
|
|
|
|
|
|
|
|
|||||||||
| Total revenues |
3,399 | 1,880 | 484 | 5,763 | ||||||||||||
| Cost of rental equipment sales |
(126 | ) | (47 | ) | (15 | ) | (188 | ) | ||||||||
| Staff costs(1) |
(662 | ) | (352 | ) | (137 | ) | (1,151 | ) | ||||||||
| Depreciation |
(704 | ) | (268 | ) | (90 | ) | (1,062 | ) | ||||||||
| Other segment items(2) |
(790 | ) | (587 | ) | (204 | ) | (1,581 | ) | ||||||||
|
|
|
|
|
|
|
|
|
|||||||||
| Adjusted Segment Operating profit |
1,117 | 626 | 38 | 1,781 | ||||||||||||
| Reconciliation of Adjusted Segment Operating Profit to income before provision for income taxes: |
||||||||||||||||
| Central costs(3) |
(441 | ) | ||||||||||||||
| Interest expense, net |
(193 | ) | ||||||||||||||
| Amortization of acquired intangibles |
(56 | ) | ||||||||||||||
|
|
|
|||||||||||||||
| Income before provision for income taxes |
1,091 | |||||||||||||||
|
|
|
|||||||||||||||
| Six months ended October 31, 2024 |
||||||||||||||||
| Equipment rentals |
$ | 3,124 | $ | 1,730 | $ | 411 | $ | 5,265 | ||||||||
| Sales of rental equipment |
179 | 43 | 26 | 248 | ||||||||||||
| Sales of new equipment, merchandise and consumables |
89 | 51 | 42 | 182 | ||||||||||||
|
|
|
|
|
|
|
|
|
|||||||||
| Total revenues |
3,392 | 1,824 | 479 | 5,695 | ||||||||||||
| Cost of rental equipment sales |
(150 | ) | (45 | ) | (17 | ) | (212 | ) | ||||||||
| Staff costs(1) |
(626 | ) | (343 | ) | (133 | ) | (1,102 | ) | ||||||||
| Depreciation |
(685 | ) | (267 | ) | (86 | ) | (1,038 | ) | ||||||||
| Other segment items(2) |
(740 | ) | (556 | ) | (195 | ) | (1,491 | ) | ||||||||
|
|
|
|
|
|
|
|
|
|||||||||
| Adjusted Segment Operating Profit |
1,191 | 613 | 48 | 1,852 | ||||||||||||
| Reconciliation of Adjusted Segment Operating Profit to income before provision for income taxes: |
||||||||||||||||
| Central costs(3) |
(359 | ) | ||||||||||||||
| Interest (income) expense, net |
(222 | ) | ||||||||||||||
| Amortization of acquired intangibles |
(58 | ) | ||||||||||||||
|
|
|
|||||||||||||||
| Income before provision for income taxes |
1,213 | |||||||||||||||
|
|
|
|||||||||||||||
F-12
Table of Contents
Ashtead Group plc
Notes to Condensed Consolidated Financial Statements
(Unaudited)
| North America | ||||||||||||||||
| (in millions) |
General Tool | Specialty | UK | Total | ||||||||||||
| As of October 31, 2025 |
||||||||||||||||
| Capital expenditures(4) |
832 | 379 | 103 | 1,314 | ||||||||||||
| Segment assets |
10,290 | 3,770 | 1,155 | 15,215 | ||||||||||||
| Corporate |
7,140 | |||||||||||||||
|
|
|
|||||||||||||||
| Total assets |
22,355 | |||||||||||||||
|
|
|
|||||||||||||||
| As of April 30, 2025 |
||||||||||||||||
| Capital expenditures(4) |
1,736 | 537 | 187 | 2,460 | ||||||||||||
| Segment assets |
10,083 | 3,623 | 1,198 | 14,904 | ||||||||||||
| Corporate |
7,066 | |||||||||||||||
|
|
|
|||||||||||||||
| Total assets |
21,970 | |||||||||||||||
|
|
|
|||||||||||||||
| (1) | Staff costs comprise of salaries and related benefits and pension costs. |
| (2) | Other segment items comprise of spares, vehicle, facility and other miscellaneous costs. |
| (3) | Central costs comprise of corporate costs incurred to run the business as a whole including costs associated with the Company’s support functions, technology expenditure and the accounting adjustment to reflect ASC 842 lease accounting in relation to the Company’s property leases. |
| (4) | Amounts due but unpaid for purchases of rental equipment were $422 million and $225 million as of October 31, 2025 and April 30, 2025, respectively. These balances are included in “Accounts payable” and “Accrued expenses and other liabilities” in the consolidated balance sheet. |
6. Inventory
Inventory consists of the following:
| (in millions) |
As of October 31, 2025 |
As of April 30, 2025 |
||||||
| Raw materials, consumables and spares |
$ | 79 | $ | 75 | ||||
| Goods for resale |
77 | 72 | ||||||
|
|
|
|
|
|||||
| Inventory |
$ | 156 | $ | 147 | ||||
|
|
|
|
|
|||||
7. Fair Value Measurements
The carrying amounts reported in the consolidated balance sheets for cash, accounts receivable, accounts payable and accrued expenses and other liabilities approximate fair value due to the immediate to short-term maturity of these financial instruments. The fair values of the first priority senior secured credit facility and finance leases approximated their book values as of October 31, 2025 and April 30, 2025. The estimated fair values of the other financial instruments were as follows:
| As of October 31, 2025 | As of April 30, 2025 | |||||||||||||||||||
| (in millions) |
Carrying Amount |
Fair Value |
Carrying Amount |
Fair Value |
||||||||||||||||
| Senior notes |
Level 1 | $ | 6,158 | $ | 6,227 | $ | 6,154 | $ | 6,018 | |||||||||||
| Contingent consideration |
Level 3 | 29 | 29 | 18 | 18 | |||||||||||||||
| Equity investments |
Level 3 | 32 | 32 | 32 | 32 | |||||||||||||||
F-13
Table of Contents
Ashtead Group plc
Notes to Condensed Consolidated Financial Statements
(Unaudited)
The senior notes are carried at amortized cost and the contingent consideration and equity investments are carried at fair value in the consolidated balance sheets.
Contingent consideration relates to recent acquisitions and is based on the post-acquisition performance of the acquired businesses. The consideration is expected to be paid out over the next seven years and is reassessed at each reporting date.
Contingent consideration is a Level 3 financial liability. Future anticipated payments in respect of contingent consideration are initially recorded at fair value which is the present value of the expected cash outflows of the obligations. The obligations are dependent upon the future financial performance of the businesses acquired. The fair value is estimated based on internal financial projections prepared in relation to the acquisition with the contingent consideration discounted to present value using a discount rate in line with the Company’s cost of debt. Details of the movement in the fair value during the six months are as follows:
| (in millions) |
||||
| Beginning Balance as of April 30, 2025 |
$ | 18 | ||
| Acquired businesses |
11 | |||
|
|
|
|||
| Ending Balance as of October 31, 2025 |
$ | 29 | ||
|
|
|
|||
8. Debt
Debt, net of unamortized original issue premiums and unamortized debt issuance costs, consists of the following:
| (in millions) |
October 31, 2025 |
April 30, 2025 |
||||||
| First priority senior secured bank debt |
$ | 1,522 | $ | 1,346 | ||||
| 1.500% senior notes, due August 2026 |
549 | 549 | ||||||
| 4.375% senior notes, due August 2027 |
598 | 598 | ||||||
| 4.000% senior notes, due May 2028 |
597 | 597 | ||||||
| 4.250% senior notes, due November 2029 |
596 | 596 | ||||||
| 2.450% senior notes, due August 2031 |
746 | 745 | ||||||
| 5.500% senior notes, due August 2032 |
741 | 740 | ||||||
| 5.550% senior notes, due May 2033 |
744 | 744 | ||||||
| 5.950% senior notes, due October 2033 |
745 | 744 | ||||||
| 5.800% senior notes, due April 2034 |
842 | 841 | ||||||
|
|
|
|
|
|||||
| Total long-term debt |
$ | 7,680 | $ | 7,500 | ||||
|
|
|
|
|
|||||
First priority senior secured credit facility
As of October 31, 2025, $4,750 million was committed by the senior lenders under the asset-based senior secured revolving credit facility (‘ABL facility’) until November 2029. The amount utilized was $1,527 million (including letters of credit totaling $5 million). The ABL facility is secured by a first priority interest in substantially all of the Company’s assets. Pricing for the $4,750 million revolving credit facility is based on average availability according to a grid, varying from the applicable interest rate plus 125bp to 137.5bp. The applicable interest rate is based on Secured Overnight Financing Rate (“SOFR”) for U.S. dollar loans, Canadian Overnight Repo Rate Average (“CORRA”) for Canadian dollar loans and Sterling Overnight Index Average (“SONIA”) for sterling loans. The borrowing rate was the applicable interest rate plus 125 basis points and the weighted average interest rate was 5.017% and 5.242% as of October 31, 2025 and April 30, 2025, respectively.
F-14
Table of Contents
Ashtead Group plc
Notes to Condensed Consolidated Financial Statements
(Unaudited)
The only financial performance covenant under the asset-based first priority senior bank facility is a fixed charge ratio (comprising last 12-month (“LTM”) earnings before interest, taxes, depreciation, and amortization (“EBITDA”) before exceptional items less LTM net capital expenditure paid in cash over the sum of scheduled debt repayments plus cash interest, cash tax payments and dividends paid in the last 12 months) which must be equal to or greater than 1.0 times.
This covenant does not, however, apply when availability (the difference between the borrowing base and facility utilization) exceeds $475 million. Availability under the bank facility for covenant purposes was $3,431 and $3,616 million as of October 31, 2025 and April 30, 2025, respectively, meaning that the covenant was not measured for the periods presented and is unlikely to be measured in forthcoming quarters.
9. Income Taxes
The Company recorded income tax expense, based upon the estimated annual effective tax rate as adjusted for discrete items, if any, of $282 million on pre-tax book income of $1,091 million, and $314 million on pre-tax book income of $1,213 million for the six months ended October 31, 2025 and 2024, respectively. This led to an effective tax rate of 26% for the six months ended October 31, 2025 and 2024. The decrease in the income tax expense was primarily driven by the decrease in pre-tax book income.
On July 4, 2025, Public Law No. 119-21, commonly referred to as the ‘One Big Beautiful Bill Act’ (‘the Act’) was enacted in the United States. The Act, among other things, permanently reinstated the additional first year depreciation allowance for qualified property (‘bonus depreciation’), permanently reinstated the Earnings Before Interest, Taxes, Depreciation and Amortization (EBITDA) approach for calculating the business interest limitation and the immediate expensing of U.S. research and experimental expenditures. An estimate of the effects of the legislation has been recorded in the six months ended October 31, 2025 leading to a $28 million reduction in the current tax expense for the year ended April 30, 2025. The legislation has no significant impact on our effective rate.
10. Commitments and Contingencies
The Company is subject to a number of claims and proceedings that generally arise in the ordinary conduct of the business. These matters include, but are not limited to, general liability claims (including personal injury, product liability, and property and automobile claims), indemnification and guarantee obligations, employee injuries and employment-related claims, self-insurance obligations and contract and real estate matters. The Company believes that any liabilities ultimately resulting from these ordinary course claims and proceedings will not, individually or in the aggregate, have a material adverse effect on the consolidated financial position, results of operations or cash flows.
11. Stock-Based Compensation
Liability-classified awards
A summary of the transactions within the Company’s liability-classified long-term incentive awards is as follows:
| Shares | ||||
| Outstanding as of April 30, 2025 |
1,646,417 | |||
| Granted |
753,877 | |||
| Exercised |
(410,573 | ) | ||
| Expired/lapsed |
(280,162 | ) | ||
|
|
|
|||
| Outstanding and exercisable as of October 31, 2025 |
1,709,559 | |||
|
|
|
|||
F-15
Table of Contents
Ashtead Group plc
Notes to Condensed Consolidated Financial Statements
(Unaudited)
Equity-classified awards
A summary of the transactions within the Company’s equity-classified long-term incentive awards is as follows:
| Shares | Weighted-Average Fair Value |
|||||||
| Outstanding as of April 30, 2025 |
543,686 | $ | 44.41 | |||||
| Granted |
199,852 | 43.00 | ||||||
| Exercised |
(51,971 | ) | 28.03 | |||||
| Expired/lapsed |
(104,701 | ) | 33.67 | |||||
|
|
|
|||||||
| Outstanding and exercisable as of October 31, 2025 |
586,866 | 50.41 | ||||||
|
|
|
|||||||
Stock-based compensation expense
Stock-based compensation expense was $34 million and $3 million for the six months ended October 31, 2025 and 2024, respectively. The Company’s stock-based compensation expense is included in selling, general and administrative expense in the Company’s consolidated statements of income.
12. Earnings Per Share
The following table sets forth the computation of basic and diluted earnings per share:
| Six Months Ended October 31, | ||||||||
| (in millions) |
2025 | 2024 | ||||||
| Numerator: |
||||||||
| Net income |
$ | 809 | $ | 899 | ||||
| Denominator: |
||||||||
| Denominator for basic earnings per share—weighted-average common shares |
425,647,876 | 436,737,953 | ||||||
| Effect of dilutive securities: |
||||||||
| Employee share options and share plan awards |
572,025 | 1,478,662 | ||||||
|
|
|
|
|
|||||
| Denominator for diluted earnings per share—weighted-average common shares |
426,219,901 | 438,216,615 | ||||||
|
|
|
|
|
|||||
| Basic earnings per share |
$ | 1.90 | $ | 2.06 | ||||
| Diluted earnings per share |
$ | 1.90 | $ | 2.05 | ||||
13. Restructuring
In line with our Sunbelt 4.0 strategic priorities for the UK segment, we initiated an operational restructure during the six months ended October 31, 2025 involving the consolidation of certain regional operations and taking steps to optimize cost efficiency. We are also seeking to exit certain non-core assets and disposed of the UK Hoist business in October 2025 for proceeds of $16 million. In total, these activities are expected to result in $40 million of non-recurring costs relating to the UK segment during the current fiscal year, with $39 million recognized in the income statement during the six months ended October 31, 2025.
F-16
Table of Contents
Ashtead Group plc
Notes to Condensed Consolidated Financial Statements
(Unaudited)
The table below presents the components of restructuring expense.
| Six Months Ended October 31, |
||||||
| (in millions) |
2025 | |||||
| Classification | Expense Type | |||||
| Cost of equipment rentals, excluding depreciation |
Employee related cost | $ | 9 | |||
| Fixed asset related cost | 3 | |||||
| Depreciation of rental equipment |
Fixed asset related cost | 11 | ||||
| Cost of rental equipment sales |
Fixed asset related cost | 2 | ||||
| Cost of sales of new equipment, merchandise and consumables |
Fixed asset related cost | 1 | ||||
| Selling, general and administrative expense |
Miscellaneous cost including professional fees | 1 | ||||
| Non-rental depreciation and amortization |
Facility related cost | 5 | ||||
| Other expense (income), net |
Loss on disposal | 7 | ||||
|
|
|
|||||
| Total restructuring cost |
$ | 39 | ||||
|
|
|
|||||
The table below presents the components of the restructuring liabilities.
| (in millions) |
Employee Related Cost |
Other Restructuring Cost |
Total Restructuring Costs |
|||||||||
| Liability balance as of April 30, 2025 |
$ | — | — | — | ||||||||
| Net charges to earnings |
9 | 1 | 10 | |||||||||
| Cash paid |
(4 | ) | — | (4 | ) | |||||||
| Foreign currency translation |
— | — | — | |||||||||
|
|
|
|
|
|
|
|||||||
| Liability balance as of October 31, 2025 |
$ | 5 | 1 | 6 | ||||||||
|
|
|
|
|
|
|
|||||||
The accruals related to the restructuring costs have been presented in Accrued expenses and other liabilities in the Company’s consolidated statements of financial position.
14. Subsequent Events
Subsequent to the balance sheet date, the Company completed the acquisition of one general tool and two specialty businesses in North America. The purchase price for these acquisitions is not material. The initial accounting for these acquisitions is incomplete due to the proximity to the period end. Had these acquisitions taken place on May 1, 2025, their impact on the revenue and net income would not have been material.
On December 9, 2025 the Company announced a new share repurchase program of up to $1.5 billion commencing on March 2, 2026, which is expected to complete by the end of April 2027.
The Company has evaluated subsequent events through December 19, 2025, the date the condensed consolidated financial statements were available to be issued.
F-17
Table of Contents
Ashtead Group plc
Consolidated Financial Statements
As of and for the Years Ended April 30, 2025, 2024 and 2023
F-18
Table of Contents
Report of Independent Registered Public Accounting Firm
To the board of directors and shareholders of Ashtead Group plc
Opinion on the Financial Statements
We have audited the accompanying consolidated balance sheets of Ashtead Group plc and its subsidiaries (the “Company”) as of April 30, 2025 and 2024, and the related consolidated statements of income, of comprehensive income, of stockholders’ equity and of cash flows for the years then ended, including the related notes (collectively referred to as the “consolidated financial statements”). In our opinion, the consolidated financial statements present fairly, in all material respects, the financial position of the Company as of April 30, 2025 and 2024, and the results of its operations and its cash flows for the years then ended in conformity with accounting principles generally accepted in the United States of America.
Basis for Opinion
These consolidated financial statements are the responsibility of the Company’s management. Our responsibility is to express an opinion on the Company’s consolidated financial statements based on our audits. We are a public accounting firm registered with the Public Company Accounting Oversight Board (United States) (PCAOB) and are required to be independent with respect to the Company in accordance with the U.S. federal securities laws and the applicable rules and regulations of the Securities and Exchange Commission and the PCAOB.
We conducted our audits of these consolidated financial statements in accordance with the standards of the PCAOB. Those standards require that we plan and perform the audits to obtain reasonable assurance about whether the consolidated financial statements are free of material misstatement, whether due to error or fraud.
Our audits included performing procedures to assess the risks of material misstatement of the consolidated financial statements, whether due to error or fraud, and performing procedures that respond to those risks. Such procedures included examining, on a test basis, evidence regarding the amounts and disclosures in the consolidated financial statements. Our audits also included evaluating the accounting principles used and significant estimates made by management, as well as evaluating the overall presentation of the consolidated financial statements. We believe that our audits provide a reasonable basis for our opinion.
Critical Audit Matters
The critical audit matter communicated below is a matter arising from the current period audit of the consolidated financial statements that was communicated or required to be communicated to the audit committee and that (i) relates to accounts or disclosures that are material to the consolidated financial statements and (ii) involved our especially challenging, subjective, or complex judgments. The communication of critical audit matters does not alter in any way our opinion on the consolidated financial statements, taken as a whole, and we are not, by communicating the critical audit matter below, providing a separate opinion on the critical audit matter or on the accounts or disclosures to which it relates.
Identification of impairment indicators of rental equipment
As described in Notes 2 and 7 to the consolidated financial statements, as of April 30, 2025, the Company recorded $11,340 million of rental equipment, net. At each reporting date, management assesses whether there are events or changes in circumstances that indicate that the rental equipment’s carrying amount may not be recoverable. Management judgement is necessary in identifying impairment indicators including the period over which assets have not been rented, the period any assets have been down for repair, the current market conditions and the level of return on investment generated from the assets.
The principal considerations for our determination that performing procedures relating to the identification of impairment indicators of rental equipment is a critical audit matter are a high degree of auditor effort in
F-19
Table of Contents
performing procedures and evaluating audit evidence related to events or changes in circumstances indicating that the carrying amounts may not be recoverable.
Addressing the matter involved performing procedures and evaluating audit evidence in connection with forming our overall opinion on the consolidated financial statements. These procedures included, among others, (i) testing management’s process for identifying rental equipment to be evaluated for impairment; (ii) testing the completeness and accuracy of underlying data used in the analysis; (iii) evaluating events or changes in circumstances indicating that the carrying amount may not be recoverable, including, the period over which assets have not been rented, the period any assets have been down for repair, the current market conditions and the level of return on investment generated from the assets and (iv) considering whether the impairment indicators used in the evaluation were consistent with (a) the current and past performance of the assets; (b) third party data; and (c) the operating model of the business and evidence obtained in other areas of the audit.
/s/ PricewaterhouseCoopers LLP
London, United Kingdom
September 5, 2025
We have served as the Company’s auditor since 2022.
F-20
Table of Contents
REPORT OF INDEPENDENT REGISTERED PUBLIC ACCOUNTING FIRM
To the shareholders and the Board of Directors of Ashtead Group plc
Opinion on the Financial Statements
We have audited the accompanying consolidated balance sheet of Ashtead Group plc and subsidiaries (the “Company”) as of April 30, 2023, the related consolidated statements of income, comprehensive income, stockholders’ equity, and cash flows, for the year ended April 30, 2023, and the related notes (collectively referred to as the “financial statements”). In our opinion, the financial statements present fairly, in all material respects, the financial position of the Company as of April 30, 2023, and the results of its operations and its cash flows for the year ended April 30, 2023, in conformity with accounting principles generally accepted in the United States of America.
Basis for Opinion
These financial statements are the responsibility of the Company’s management. Our responsibility is to express an opinion on the Company’s financial statements based on our audit. We are a public accounting firm registered with the Public Company Accounting Oversight Board (United States) (PCAOB) and are required to be independent with respect to the Company in accordance with the U.S. federal securities laws and the applicable rules and regulations of the Securities and Exchange Commission and the PCAOB.
We conducted our audit in accordance with the standards of the PCAOB. Those standards require that we plan and perform the audit to obtain reasonable assurance about whether the financial statements are free of material misstatement, whether due to error or fraud. The Company is not required to have, nor were we engaged to perform, an audit of its internal control over financial reporting. As part of our audit, we are required to obtain an understanding of internal control over financial reporting but not for the purpose of expressing an opinion on the effectiveness of the Company’s internal control over financial reporting. Accordingly, we express no such opinion.
Our audit included performing procedures to assess the risks of material misstatement of the financial statements, whether due to error or fraud, and performing procedures that respond to those risks. Such procedures included examining, on a test basis, evidence regarding the amounts and disclosures in the financial statements. Our audit also included evaluating the accounting principles used and significant estimates made by management, as well as evaluating the overall presentation of the financial statements. We believe that our audit provides a reasonable basis for our opinion.
/s/ Deloitte LLP
London, United Kingdom
September 5, 2025
We began serving as the Company’s auditor in 2025. In 2025, we became the predecessor auditor.
F-21
Table of Contents
Ashtead Group plc
(in millions, except par value and share amounts)
| As of April 30, | ||||||||||||
| 2025 | 2024 | 2023 | ||||||||||
| ASSETS |
||||||||||||
| Cash and cash equivalents |
$21 | $21 | $30 | |||||||||
| Accounts receivable, net of allowance for credit losses of $102, $141 and $107, respectively |
1,481 | 1,528 | 1,385 | |||||||||
| Inventory |
147 | 162 | 181 | |||||||||
| Prepaid expenses and other assets |
372 | 331 | 282 | |||||||||
|
|
|
|
|
|
|
|||||||
| Total current assets |
2,021 | 2,042 | 1,878 | |||||||||
|
|
|
|
|
|
|
|||||||
| Rental equipment, net |
11,340 | 11,465 | 9,649 | |||||||||
| Property and equipment, net |
2,038 | 1,911 | 1,509 | |||||||||
| Goodwill |
3,348 | 3,280 | 2,935 | |||||||||
| Other intangible assets, net |
433 | 526 | 550 | |||||||||
| Operating lease right-of-use assets |
2,523 | 2,403 | 2,107 | |||||||||
| Other long-term assets |
267 | 257 | 219 | |||||||||
|
|
|
|
|
|
|
|||||||
| Total non-current assets |
19,949 | 19,842 | 16,969 | |||||||||
|
|
|
|
|
|
|
|||||||
| Total assets |
$ | 21,970 | $ | 21,884 | $ | 18,847 | ||||||
|
|
|
|
|
|
|
|||||||
| LIABILITIES AND STOCKHOLDERS’ EQUITY |
||||||||||||
| Accounts payable |
$302 | $522 | $582 | |||||||||
| Accrued expenses and other liabilities |
991 | 1,142 | 1,077 | |||||||||
| Operating lease liabilities |
266 | 249 | 217 | |||||||||
|
|
|
|
|
|
|
|||||||
| Total current liabilities |
1,559 | 1,913 | 1,876 | |||||||||
|
|
|
|
|
|
|
|||||||
| Long-term debt |
7,500 | 7,995 | 6,595 | |||||||||
| Deferred taxes |
2,288 | 2,248 | 2,001 | |||||||||
| Non-current portion of operating lease liabilities |
2,434 | 2,311 | 2,026 | |||||||||
| Other long-term liabilities |
390 | 357 | 339 | |||||||||
|
|
|
|
|
|
|
|||||||
| Total non-current liabilities |
12,612 | 12,911 | 10,961 | |||||||||
|
|
|
|
|
|
|
|||||||
| Total liabilities |
14,171 | 14,824 | 12,837 | |||||||||
|
|
|
|
|
|
|
|||||||
| Commitments and contingencies (Note 15) |
||||||||||||
| Stockholders’ equity: |
||||||||||||
| Common stock – £0.10 par value, 451,354,833 and 430,708,216 shares issued and outstanding, respectively, as of April 30, 2025, 451,354,833 and 436,444,938 shares issued and outstanding, respectively, as of April 30, 2024 and 451,354,833 and 437,506,567 shares issued and outstanding, respectively, as of April 30, 2023 |
82 | 82 | 82 | |||||||||
| Additional paid-in capital |
46 | 37 | 35 | |||||||||
| Retained earnings |
9,103 | 8,084 | 6,937 | |||||||||
| Treasury stock at cost – 20,111,957, 14,056,026 and 12,861,499 shares as of April 30, 2025, 2024 and 2023, respectively |
(1,171 | ) | (819 | ) | (741 | ) | ||||||
| Common stock held by the ESOT – 534,660, 853,869 and 986,767 shares as of April 30, 2025, 2024 and 2023, respectively |
(35 | ) | (44 | ) | (39 | ) | ||||||
| Accumulated other comprehensive loss |
(226 | ) | (280 | ) | (264 | ) | ||||||
|
|
|
|
|
|
|
|||||||
| Total stockholders’ equity |
7,799 | 7,060 | 6,010 | |||||||||
|
|
|
|
|
|
|
|||||||
| Total liabilities and stockholders’ equity |
$ | 21,970 | $ | 21,884 | $ | 18,847 | ||||||
|
|
|
|
|
|
|
|||||||
See accompanying notes to the consolidated financial statements.
F-22
Table of Contents
Ashtead Group plc
Consolidated Statements of Income
(in millions, except per share amounts)
| Year Ended April 30 | ||||||||||||
| 2025 | 2024 | 2023 | ||||||||||
| Revenues: |
||||||||||||
| Equipment rentals |
$9,980 | $9,630 | $8,698 | |||||||||
| Sales of rental equipment |
467 | 859 | 627 | |||||||||
| Sales of new equipment, merchandise and consumables |
344 | 370 | 342 | |||||||||
|
|
|
|
|
|
|
|||||||
| Total revenues |
10,791 | 10,859 | 9,667 | |||||||||
| Cost of revenues: |
||||||||||||
| Cost of equipment rentals, excluding depreciation |
4,069 | 3,874 | 3,503 | |||||||||
| Depreciation of rental equipment |
1,815 | 1,653 | 1,393 | |||||||||
| Cost of rental equipment sales |
386 | 636 | 442 | |||||||||
| Cost of sales of new equipment, merchandise and consumables |
201 | 219 | 201 | |||||||||
|
|
|
|
|
|
|
|||||||
| Total cost of revenues |
6,471 | 6,382 | 5,539 | |||||||||
|
|
|
|
|
|
|
|||||||
| Gross profit |
4,320 | 4,477 | 4,128 | |||||||||
|
|
|
|
|
|
|
|||||||
| Selling, general and administrative expenses |
1,385 | 1,572 | 1,348 | |||||||||
| Non-rental depreciation and amortization |
436 | 394 | 334 | |||||||||
|
|
|
|
|
|
|
|||||||
| Operating income |
2,499 | 2,511 | 2,446 | |||||||||
| Interest expense, net |
425 | 428 | 275 | |||||||||
| Other expense (income), net |
4 | (11 | ) | 19 | ||||||||
|
|
|
|
|
|
|
|||||||
| Income before provision for income taxes |
2,070 | 2,094 | 2,152 | |||||||||
| Provision for income taxes |
517 | 522 | 547 | |||||||||
|
|
|
|
|
|
|
|||||||
| Net income |
$1,553 | $1,572 | $1,605 | |||||||||
|
|
|
|
|
|
|
|||||||
| Basic earnings per share |
3.56 | 3.60 | 3.66 | |||||||||
| Diluted earnings per share |
3.55 | 3.58 | 3.64 | |||||||||
See accompanying notes to the consolidated financial statements.
F-23
Table of Contents
Ashtead Group plc
Consolidated Statements of Comprehensive Income
(in millions)
| Year Ended April 30, | ||||||||||||
| 2025 | 2024 | 2023 | ||||||||||
| Net income |
$1,553 | $1,572 | $1,605 | |||||||||
| Other comprehensive income (loss), net of tax : |
||||||||||||
| Foreign currency translation adjustments(1) |
54 | (16 | ) | (21 | ) | |||||||
| Loss on cash flow hedge |
— | — | (3 | ) | ||||||||
|
|
|
|
|
|
|
|||||||
| Other comprehensive income (loss) |
54 | (16 | ) | (24 | ) | |||||||
|
|
|
|
|
|
|
|||||||
| Total comprehensive income |
$1,607 | $1,556 | $1,581 | |||||||||
|
|
|
|
|
|
|
|||||||
| (1) | There was no material tax impact related to the foreign currency translation adjustments during the years ended April 30, 2025, 2024 and 2023. |
See accompanying notes to the consolidated financial statements.
F-24
Table of Contents
Ashtead Group plc
Consolidated Statements of Stockholders’ Equity
(in millions, except per share and share amounts)
| Common Stock | Additional Paid-in Capital |
Retained Earnings |
Treasury Stock | Common stock held by the ESOT |
Accumulated Other Comprehensive Loss |
Total Stockholders’ Equity |
||||||||||||||||||||||||||||||||||
| Number of Shares |
Amount | Number of Shares |
Amount | Number of Shares |
Amount | |||||||||||||||||||||||||||||||||||
| Balance as of May 1, 2022 |
451,354,833 | $82 | $32 | $5,687 | 7,681,943 | $(480 | ) | 1,231,788 | $(45 | ) | $(240 | ) | $5,036 | |||||||||||||||||||||||||||
| Net income |
— | — | — | 1,605 | — | — | — | — | — | 1,605 | ||||||||||||||||||||||||||||||
| Foreign currency translation adjustments |
— | — | — | — | — | — | — | — | (21 | ) | (21 | ) | ||||||||||||||||||||||||||||
| Loss on cash flow hedge |
— | — | — | — | — | — | — | — | (3 | ) | (3 | ) | ||||||||||||||||||||||||||||
| Dividends, $0.83 per share |
— | — | — | (357 | ) | — | — | — | — | — | (357 | ) | ||||||||||||||||||||||||||||
| Stock based compensation |
— | — | 3 | 2 | — | — | — | 19 | — | 24 | ||||||||||||||||||||||||||||||
| Repurchase of common stock |
— | — | — | — | 5,179,556 | (261 | ) | (245,021 | ) | (13 | ) | — | (274 | ) | ||||||||||||||||||||||||||
|
|
|
|
|
|
|
|
|
|
|
|
|
|
|
|
|
|
|
|
|
|||||||||||||||||||||
| Balance as of April 30, 2023 |
451,354,833 | 82 | 35 | 6,937 | 12,861,499 | (741 | ) | 986,767 | (39 | ) | (264 | ) | 6,010 | |||||||||||||||||||||||||||
| Net income |
— | — | — | 1,572 | — | — | — | — | — | 1,572 | ||||||||||||||||||||||||||||||
| Foreign currency translation adjustment |
— | — | — | — | — | — | — | — | (16 | ) | (16 | ) | ||||||||||||||||||||||||||||
| Dividends, $1.01 per share |
— | — | — | (437 | ) | — | — | — | — | — | (437 | ) | ||||||||||||||||||||||||||||
| Stock based compensation |
— | — | 2 | 12 | — | — | — | 25 | — | 39 | ||||||||||||||||||||||||||||||
| Repurchase of common stock |
— | — | — | — | 1,194,527 | (78 | ) | (132,898 | ) | (30 | ) | — | (108 | ) | ||||||||||||||||||||||||||
|
|
|
|
|
|
|
|
|
|
|
|
|
|
|
|
|
|
|
|
|
|||||||||||||||||||||
| Balance as of April 30, 2024 |
451,354,833 | 82 | 37 | 8,084 | 14,056,026 | (819 | ) | 853,869 | (44 | ) | (280 | ) | 7,060 | |||||||||||||||||||||||||||
| Net income |
— | — | — | 1,553 | — | — | — | — | — | 1,553 | ||||||||||||||||||||||||||||||
| Foreign currency translation adjustments |
— | — | — | — | — | — | — | — | 54 | 54 | ||||||||||||||||||||||||||||||
| Dividends, $1.25 per share |
— | — | — | (547 | ) | — | — | — | — | — | (547 | ) | ||||||||||||||||||||||||||||
| Stock based compensation |
— | — | 9 | 13 | — | — | — | 94 | — | 116 | ||||||||||||||||||||||||||||||
| Repurchase of common stock |
— | — | — | — | 6,055,931 | (352 | ) | (319,209 | ) | (85 | ) | — | (437 | ) | ||||||||||||||||||||||||||
|
|
|
|
|
|
|
|
|
|
|
|
|
|
|
|
|
|
|
|
|
|||||||||||||||||||||
| Balance as of April 30, 2025 |
451,354,833 | $82 | $46 | $9,103 | 20,111,957 | $(1,171) | 534,660 | $(35 | ) | $(226 | ) | $7,799 | ||||||||||||||||||||||||||||
|
|
|
|
|
|
|
|
|
|
|
|
|
|
|
|
|
|
|
|
|
|||||||||||||||||||||
See accompanying notes to the consolidated financial statements.
F-25
Table of Contents
Ashtead Group plc
Consolidated Statements of Cash Flows
(in millions)
| Year Ended April 30, | ||||||||||||
| 2025 | 2024 | 2023 | ||||||||||
| Cash flows from operating activities: |
||||||||||||
| Net income |
$1,553 | $1,572 | $1,605 | |||||||||
| Adjustments to reconcile net income to net cash provided by operating activities: |
||||||||||||
| Depreciation and amortization |
2,251 | 2,047 | 1,727 | |||||||||
| Gain on sales of rental equipment |
(81 | ) | (223 | ) | (185 | ) | ||||||
| Gain on sales of non-rental equipment |
(17 | ) | (17 | ) | (18 | ) | ||||||
| Deferred tax expense (benefit) |
42 | 236 | 281 | |||||||||
| Operating lease expense |
288 | 262 | 217 | |||||||||
| Stock based compensation expense |
(9 | ) | 92 | 53 | ||||||||
| Provision for receivable allowances |
28 | 84 | 47 | |||||||||
| Other |
33 | 10 | 50 | |||||||||
| Changes in operating assets and liabilities, net of amounts acquired: |
||||||||||||
| Decrease (Increase) in accounts receivable |
22 | (184 | ) | (172 | ) | |||||||
| Decrease (Increase) in inventory |
15 | 21 | (5 | ) | ||||||||
| Increase in prepaid expenses and other assets |
(74 | ) | (89 | ) | (103 | ) | ||||||
| Increase (Decrease) in accounts payable |
2 | (24 | ) | (34 | ) | |||||||
| Decrease in operating lease liabilities |
(268 | ) | (243 | ) | (200 | ) | ||||||
| Increase in accrued expenses and other liabilities |
59 | 120 | 83 | |||||||||
|
|
|
|
|
|
|
|||||||
| Net cash provided by operating activities |
$3,844 | $3,664 | $3,346 | |||||||||
|
|
|
|
|
|
|
|||||||
| Cash flows from investing activities |
||||||||||||
| Payments for acquisition of businesses, net of cash acquired |
(134 | ) | (846 | ) | (1,061 | ) | ||||||
| Payments for purchases of rental equipment |
(2,251 | ) | (3,759 | ) | (3,020 | ) | ||||||
| Payments for non-rental property and equipment |
(441 | ) | (659 | ) | (500 | ) | ||||||
| Proceeds from sales of rental equipment |
462 | 832 | 574 | |||||||||
| Proceeds from disposal of non-rental property and equipment |
61 | 48 | 41 | |||||||||
| Payments for purchases of intangibles |
(15 | ) | (29 | ) | (10 | ) | ||||||
| Other |
— | (15 | ) | (42 | ) | |||||||
|
|
|
|
|
|
|
|||||||
| Net cash used in investing activities |
$(2,318 | ) | $(4,428 | ) | $(4,018 | ) | ||||||
|
|
|
|
|
|
|
|||||||
| Cash flows from financing activities |
||||||||||||
| Proceeds from debt |
1,309 | 3,616 | 3,355 | |||||||||
| Payments of debt |
(1,832 | ) | (2,275 | ) | (2,002 | ) | ||||||
| Repayments of principal under finance lease liabilities |
(18 | ) | (12 | ) | (8 | ) | ||||||
| Payment of contingent consideration |
(13 | ) | (30 | ) | (22 | ) | ||||||
| Dividends paid |
(544 | ) | (436 | ) | (358 | ) | ||||||
| Common stock repurchased by the ESOT, including tax on stock based compensation |
(86 | ) | (30 | ) | (13 | ) | ||||||
| Common stock repurchased by the Company, including tax on stock based compensation |
(342 | ) | (78 | ) | (264 | ) | ||||||
|
|
|
|
|
|
|
|||||||
| Net cash (used in) provided by financing activities |
$(1,526 | ) | $755 | $688 | ||||||||
|
|
|
|
|
|
|
|||||||
| Effect of exchange rate changes on cash and cash equivalents |
— | — | (1 | ) | ||||||||
|
|
|
|
|
|
|
|||||||
| Net increase (decrease) in cash and cash equivalents |
— | (9 | ) | 15 | ||||||||
| Cash and cash equivalents at the beginning of the year |
21 | 30 | 15 | |||||||||
|
|
|
|
|
|
|
|||||||
| Cash and cash equivalents at the end of the year |
$21 | $21 | $30 | |||||||||
|
|
|
|
|
|
|
|||||||
| Supplemental disclosure of cash flow information: |
||||||||||||
| Cash paid for interest |
$416 | $392 | $245 | |||||||||
| Cash paid for income taxes, net |
$425 | $246 | $287 | |||||||||
See accompanying notes to the consolidated financial statements.
F-26
Table of Contents
Ashtead Group plc
Notes to Consolidated Financial Statements
1. Organization and Description of Business
Ashtead Group plc (“the Company”) is an international equipment rental company, incorporated in England and Wales, with national networks in the United States (“U.S.”), Canada and the United Kingdom (“UK”), trading under the Sunbelt Rentals brand. As used in this report, the terms the “Company,” and “Ashtead,” refer to Ashtead Group plc and its subsidiaries, unless otherwise indicated.
The Company rents a broad range of construction, industrial, general and specialty equipment across a wide variety of applications to a diverse customer base.
2. Basis of Presentation and Significant Accounting Policies
Basis of Presentation and Principles of Consolidation
The accompanying consolidated financial statements have been prepared in conformity with accounting principles generally accepted in the United States (“U.S. GAAP”) and pursuant to the rules and regulations of the Securities and Exchange Commission (“SEC”). The Company’s fiscal year ends on April 30. The accompanying consolidated financial statements include the accounts of the Company, its wholly owned subsidiaries and its partially owned subsidiaries where the Company has controlling financial interest. All intercompany balances and transactions have been eliminated on consolidation.
Foreign Currency Translation and Transactions
The accompanying consolidated financial statements are presented in U.S. dollars. The functional currency of the Company’s subsidiaries is the currency of the primary economic environment in which they operate. Assets and liabilities of foreign subsidiaries that have a functional currency other than U.S. dollars are translated into U.S. dollars using exchange rates at the balance sheet date. Revenues and expenses are translated at average exchange rates effective during the year. Foreign currency translation gains and losses are included as a component of accumulated other comprehensive loss within stockholders’ equity. Foreign currency gains and losses resulting from transactions are included in the income statement.
Use of Estimates
The preparation of financial statements in conformity with U.S. GAAP requires management to make estimates and assumptions that affect the amounts reported in the financial statements and accompanying notes. Significant items subject to such estimates include, but are not limited to, allowance for credit losses, depreciation and amortization, income taxes and reserves for claims. Actual results could materially differ from those estimates.
Concentrations of Credit Risk
Financial instruments that potentially subject the Company to significant concentrations of credit risk include cash and cash equivalents and accounts receivable. The Company maintains cash and cash equivalents with high quality financial institutions. Concentration of credit risk with respect to receivables is limited due to a large customer base of unrelated customers. The Company manages credit risk using credit reference agencies and the maintenance of credit control functions. During the years ended April 30, 2025, 2024 and 2023, no individual customer accounted for 10% or more of total revenues and no customer represented 10% or more of total accounts receivable.
Cash and Cash Equivalents
Cash and cash equivalents comprises cash balances and highly liquid instruments with maturities of less than, or equal to, three months.
F-27
Table of Contents
Ashtead Group plc
Notes to Consolidated Financial Statements
Allowance for Credit Losses
Accounts receivable is stated net of allowances. The allowances for credit losses reflect the Company’s estimate of the amount of receivables that it will be unable to collect based on historical write-off experience reflecting the level of uncollected receivables over the last year within each business, adjusted for factors that are specific to the receivables, the industry in which the Company operates and the economic environment. Adjustments to the loss allowances are recognized in the income statement. Accounts receivables are written off when recoverability is assessed as being remote while subsequent recoveries of amounts previously written off are credited to the income statement.
Inventory
Inventory consists of equipment, fuel, merchandise and spare parts. Inventory is stated at the lower of cost or market. The cost of inventory that is not ordinarily interchangeable is valued at individual cost. The cost of other inventories is determined on a first-in, first-out basis or using a weighted average cost formula, depending on the basis most suited to the type of inventory held.
Rental Equipment
Rental equipment is recorded at cost and depreciated over the estimated useful life of the equipment using the straight-line method. Cost includes rebuild costs when the rebuild extends the asset’s useful economic life and it is probable that incremental economic benefits will accrue to the Company. Rebuild costs include the cost of transporting the equipment to and from the rebuild supplier.
The range of estimated useful lives for rental equipment is 3 to 25 years. The estimated useful lives are derived from asset class characteristics, historical usage trends, anticipated service period, and prevailing industry standards. However, the majority of our fleet is depreciated over 5 to 10 years. For example, mobile elevating work platforms are depreciated over 10 years, earthmoving equipment is depreciated over 5 to 10 years, power and HVAC equipment is depreciated over 6 to 10 years and forklifts are depreciated over 5 to 10 years. Longer useful lives are generally assigned to specialized or non-mechanical assets of a highly durable nature, consistent with their expected service duration. We regularly evaluate the ongoing appropriateness of the asset lives assigned.
Rental equipment is depreciated to a salvage value of 10 to 15 percent of cost in respect of most types of rental equipment, although the range of residual values used varies between zero and 35%. Costs incurred in the repair and maintenance of rental equipment are charged to the income statement as incurred.
At each reporting date, management assesses whether there are events or changes in circumstances that indicate that the rental equipment’s carrying amount may not be recoverable. Management judgement is necessary in identifying impairment indicators, including the period over which assets have not been rented, the period any assets have been down for repair, the current market conditions and the level of return on investment generated from the assets.
Property and Equipment
Property and equipment are recorded at cost and depreciated over their estimated useful lives using the straight-line method. The estimated useful lives of the Company’s property and equipment are as follows:
| Buildings |
50 years | |
| Motor vehicles |
4 – 14 years | |
| Office and workshop equipment |
5 years |
F-28
Table of Contents
Ashtead Group plc
Notes to Consolidated Financial Statements
Costs incurred in the repair and maintenance of property and equipment are charged to the income statement as incurred and are included in “Selling, general and administrative expenses” and “Cost of rental equipment sales” in the consolidated statements of income.
Business Combinations
The Company has made multiple acquisitions during the periods presented and may continue to make acquisitions in the future. The assets acquired and liabilities assumed are recorded based on their respective fair values at the date of acquisition. The consideration transferred in a business combination is the fair value at the acquisition date of the assets transferred and the liabilities assumed by the Company and includes the fair value of any contingent consideration arrangement. The estimated range of undiscounted payment in respect of the contingent consideration is zero to $23 million, zero to $37 million and zero to $48 million as of April 30, 2025, 2024 and 2023, respectively. Long-lived assets (principally rental equipment), goodwill and other intangible assets generally represent the largest components of the acquisition assets acquired. Rental equipment is valued utilizing either a cost or market approach, depending on the asset being valued and the availability of market data. Goodwill is calculated as the excess of the cost of the acquired business over the net of the fair value of the assets acquired and the liabilities assumed. The intangible assets that the Company has acquired are primarily non-compete agreements and customer relationships, which are valued based on an excess earnings or income approach based on projected cash flows and may be amortized over the useful life if they are determined to be finite-lived intangible assets.
Determining the fair value of the assets and liabilities acquired can be judgmental in nature and can involve the use of significant estimates and assumptions. The estimates and assumptions used in valuing acquired assets include, but are not limited to, the amount and timing of projected future cash flows, discount rates used to determine the present value of these cash flows and the useful lives of the assets. Although the Company’s fair value estimates are based upon assumptions believed to be reasonable, these estimates and assumptions are inherently uncertain and subject to refinement. As a result, during the measurement period of one year from the acquisition date, the Company may record adjustments to the assets acquired and liabilities assumed with the corresponding offset to goodwill. Upon conclusion of the measurement period or final determination of fair values of the purchase price of an acquisition, whichever comes first, any subsequent adjustments are recorded in earnings on the income statement.
As part of an acquisition, the Company will also acquire other assets and assume liabilities. These other assets and liabilities typically include, but are not limited to, inventory, accounts receivable, accounts payable and other working capital items. Due to their short-term nature, the fair values of these other assets and liabilities generally approximate the book values on the acquired entities’ balance sheets. Acquisition-related expenses are recognized separately from the business combination and expensed as selling, general and administrative expenses in the income statement as incurred.
Evaluation of Goodwill Impairment
On an annual basis and at interim periods when events or circumstances indicate that an impairment loss may have been incurred, the Company tests the recoverability of its goodwill at the reporting unit level. The annual analysis is conducted in the fourth quarter of each fiscal year. A reporting unit is the same as, or one level below, an operating segment for which discrete financial information is available and regularly reviewed by segment management. However, components are aggregated as a single reporting unit if they have similar economic characteristics. The Company has three reporting units which are the same as its operating segments. The Company compares the carrying value of its reporting units to its fair value and if the carrying value of the reporting unit is greater than its fair value, the Company recognizes an impairment charge for the amount equal to that excess, limited to the total amount of goodwill allocated to the reporting unit.
F-29
Table of Contents
Ashtead Group plc
Notes to Consolidated Financial Statements
The Company may first assess qualitative factors to determine whether it is more-likely-than-not that the fair value of a reporting unit is less than its carrying amount as a basis for determining whether it is necessary to perform the quantitative goodwill impairment test. If a quantitative impairment test is performed, the fair value of the reporting unit is estimated using a combination of an income approach on the present value of estimated future cash flows and a market approach based on published earnings multiples of comparable entities with similar operations and economic characteristics as well as acquisition multiples paid in recent transactions. The Company’s discounted cash flows are based upon reasonable and appropriate assumptions, which are weighted for their likely probability of occurrence, about the underlying business activities of the Company. There were no indicators of impairment during any of the periods presented.
Other Intangible Assets
Other intangible assets consist of brand names, customer lists and contract related intangible assets, and are amortized over their estimated useful lives using the straight-line method. The Company evaluates the estimated remaining useful life of its other intangible assets and whether events or changes in circumstances warrant a revision to the remaining period of amortization at each period end. The estimated useful lives of the other intangible assets are as follows:
| Brand names |
1 – 14 years | |
| Customer lists |
2 – 14 years | |
| Contract related intangible assets |
2 – 7 years | |
| Internal use software |
1 – 5 years |
Impairment of Long-lived Assets Other than Goodwill
Long-lived assets are recorded at the lower of amortized cost or fair value. As part of an ongoing review of the valuation of long-lived assets, the Company assesses the carrying value of such assets if facts and circumstances suggest they may be impaired. If this review indicates the carrying value of such an asset may not be recoverable, as determined by an undiscounted cash flow analysis over the remaining useful life, the carrying value would be reduced to its estimated fair value.
Leases – The Company as the Lessee
The Company determines if an agreement is a lease at inception. The Company’s material lease contracts are generally for real estate or vehicles, and the determination of whether such contracts contain leases generally does not require significant estimates or judgements. The Company considers the contractual terms to determine the lease term used to record each lease agreement. The lease terms may include options, at the Company’s sole discretion, to extend or terminate the lease that it is reasonably certain to exercise. The Company determines the lease term used to record each lease by including the initial lease term and, in the case where there are options to extend, will include the option to extend if it has determined that it reasonably certain that the Company would exercise those options. Most real estate leases include one or more options to renew, with renewal periods typically of five years each.
Leases are classified as either finance or operating at inception of the lease and reassessed each time a lease is modified, with classification affecting the pattern of expense recognition in the income statement. Operating and finance leases result in the recognition of right-of-use (“ROU”) assets and lease liabilities on the balance sheet. ROU assets represent the Company’s right to use the leased asset for the lease term and lease liabilities represent the obligation to make lease payments. The ROU assets also include any lease payments made and less any lease incentives received.
F-30
Table of Contents
Ashtead Group plc
Notes to Consolidated Financial Statements
As the implicit rate of most of our leases is not readily determinable, the liability is calculated as the present value of the remaining minimum lease payments using the Company’s incremental borrowing rate at the commencement of the lease. The determination of the incremental borrowing rate takes into consideration the expected term of the lease, the currency in which the lease is denominated, and a financing spread adjustment based on the actual borrowing rate incurred by the Company. Operating lease cost is recorded on a straight-line basis over the remaining lease term. Finance lease cost includes amortization of the ROU assets on a straight-line basis over the shorter of the lease term or the useful life of the underlying asset and interest on the lease liabilities using the effective interest method.
Leases with a lease term of 12 months or less are not recorded on the balance sheet. Lease expense for these leases is recognized on a straight-line basis over the lease term. The Company also leases certain equipment that it rents to its customers where the payments vary based upon the amount of time the equipment is on rent. The Company generates sublease revenue from such leases that it refers to as “re-rent revenue” as discussed under “Equipment rental revenue” in Note 2 to the consolidated financial statements. The initial term of these leases is 12 months or less and, therefore, no lease liability or ROU assets have been recorded. Apart from the re-rent revenue discussed in Note 2, the Company does not generate material sublease income.
Fair Value Measurement
Fair value measurements are categorized in one of the following three levels based on the lowest level input that is significant to the fair value measurement in its entirety:
Level 1 - Inputs to the valuation methodology are unadjusted quoted prices in active markets for identical assets or liabilities.
Level 2 - Observable inputs other than quoted prices in active markets for identical assets or liabilities include:
a) quoted prices for similar assets or liabilities in active markets;
b) quoted prices for identical or similar assets or liabilities in inactive markets;
c) inputs other than quoted prices that are observable for the asset or liability;
d) inputs that are derived principally from or corroborated by observable market data by correlation or other means.
If the asset or liability has a specified (contractual) term, the Level 2 input must be observable for substantially the full term of the asset or liability.
Level 3 - Inputs to the valuation methodology are unobservable (i.e., supported by little or no market activity) and significant to the fair value measure.
Revenue Recognition
The Company is principally engaged in the business of renting equipment. Ancillary to the Company’s principal equipment rental business, the Company also sells used rental equipment, new equipment and merchandise and consumables and offers certain services to support its customers. The Company’s rental transactions are accounted for under ASC Topic 842, Leases, (“Topic 842”), while the sale of rental and new equipment, merchandise and consumables along with certain services provided to customers are recognized under ASC Topic 606, Revenue from Contracts with Customers, (“Topic 606”). Sales and other tax amounts collected from customers and remitted to government authorities are accounted for on a net basis and, therefore, excluded from revenue.
F-31
Table of Contents
Ashtead Group plc
Notes to Consolidated Financial Statements
Lease revenues (Topic 842)
Equipment rental revenue
The Company offers a broad portfolio of equipment for rent. Equipment rental revenue includes revenue generated from renting equipment to customers and is recognized on a straight-line basis over the length of the rental contract. These lease contracts are operating leases under Topic 842. As the rental contracts can extend across reporting periods, the Company records unbilled rental revenues and deferred revenues at the end of reporting periods to ensure rental revenues earned is appropriately stated for the periods presented. Receivables from unbilled rental revenue is included in “Prepaid expenses and other current assets” and was $123 million, $117 million and $105 million as of April 30, 2025, 2024 and 2023, respectively. Deferred revenue is included in “Accrued expenses and other liabilities” in the consolidated balance sheet.
Also included in equipment rental revenue is re-rent revenue in which the Company will rent specific pieces of equipment from vendors and then re-rent that equipment to its customers. Provisions for discounts, rebates to customers and other adjustments are provided for in the period the related revenue is recorded.
Other
Other equipment rental revenue is primarily comprised of fees for the Company’s loss damage waiver and environmental charges. Fees paid for the loss damage waiver allow customers to limit the risk of financial loss in the event the Company’s equipment is damaged or lost. Fees for the loss damage waiver and environmental recovery fees are recognized on a straight-line basis over the length of the rental contract.
Revenues from contracts with customers (Topic 606)
Delivery and pick-up is rental delivery and collection revenue which is recognized when the services are performed at the time of delivery or collection, respectively, and the performance obligation is therefore fulfilled.
Other rental revenue: Other is primarily comprised of revenues associated with the consumption of fuel by our customers, erection and dismantling services provided and other ancillary services provided in connection with the rental of equipment. The company recognizes revenue as the services are provided.
Sales of rental equipment, new equipment, merchandise and consumables are recognized when control of the asset transfers to the customer, which is typically when the asset is picked up by, or delivered to, the customer and when significant risks and rewards of ownership have passed to the customer. The Company routinely sells its used rental equipment in order to manage repair and maintenance costs, as well as the composition, age and size of its fleet. The Company disposes of used equipment through a variety of channels including retail sales to customers and other third parties, sales to wholesalers, brokered sales and auctions. Sales of rental equipment in connection with trade-in arrangements with certain manufacturers from whom the Company purchases new equipment is accounted for at the lower of transaction value or fair value based on independent appraisals. If the trade-in price of a unit of equipment exceeds the fair market value of that unit, the excess is accounted for as a reduction of the cost of the related purchase of new rental equipment.
The Company also sells new equipment, parts and supplies. The types of new equipment that the Company sells vary by location and include a variety of tools and supplies, small equipment, safety supplies and consumables. Also included in sales of new equipment, merchandise and consumables are other revenues earned from equipment management and similar services for rental customers. The Company recognizes the other revenue as the services are provided.
F-32
Table of Contents
Ashtead Group plc
Notes to Consolidated Financial Statements
Contract assets and liabilities
The Company does not have material contract assets or contract liabilities associated with customer contracts. The Company’s contracts with customers do not generally result in material amounts billed to customers in excess of recognizable revenue. The Company did not recognize material revenue during the years ended April 30, 2025, 2024 or 2023 that was included in the contract liability balance as of the beginning of each period.
Performance obligations
Most of the Company’s revenue recognized under Topic 606 is recognized at a point-in-time, rather than over time. Accordingly, in any particular period, the Company does not recognize a significant amount of revenue from performance obligations satisfied in previous periods, and the amounts of such revenue recognized during the years ended April 30, 2025, 2024 and 2023 were not material. The Company also does not expect to recognize material revenue in the future related to performance obligations that were unsatisfied as of April 30, 2025.
Payment terms
The Topic 606 revenues do not include material amounts of variable consideration. The credit periods offered to customers vary according to the credit risk profiles of, and the invoicing conventions established in, the Company’s markets. The contractual terms on invoices issued to customers vary between North America and the UK, in that invoices issued in the UK are payable within 30-60 days whereas invoices issued in North America are payable within 30 days. The contracts do not include a significant financing component.
Contract estimates and judgments
The revenues accounted for under Topic 606 do not require significant estimates or judgments, primarily for the following reasons:
| • | The transaction price is generally fixed and stated on the Company’s contracts; |
| • | As noted above, the Company’s contracts generally do not include multiple performance obligations, and accordingly do not generally require estimates of the standalone selling price for each performance obligation; |
| • | The revenues do not include material amounts of variable consideration; and |
| • | Most of the Company’s revenue is recognized as of a point-in-time and the timing of the satisfaction of the applicable performance obligations is readily determinable. As noted above, the Topic 606 revenue is generally recognized at the time of delivery to, or pick-up by, the customer. |
The revenues accounted for under Topic 842 also do not require significant estimate or judgements.
Insurance
The Company is exposed to various claims, including those for which the Company provides self-insurance. Claims for which the Company self-insures include: (i) workers compensation claims; (ii) general liability claims by third parties for injury or property damage caused by our equipment or personnel; and (iii) automobile liability claims. These types of claims may take a substantial amount of time to resolve and, accordingly, the ultimate liability associated with a particular claim, including claims incurred but not reported as of a period-end reporting date, may not be known for an extended period of time. The Company’s methodology for developing
F-33
Table of Contents
Ashtead Group plc
Notes to Consolidated Financial Statements
self-insurance reserves is based on management estimates and independent third-party actuarial estimates. The estimation process considers, among other matters, the cost of known claims over time, cost inflation and incurred but not reported claims. These estimates may change based on, among other things, changes in the Company’s claim history or receipt of additional information relevant to assessing the claims and the amount of the recorded liability is adjusted to reflect these changes.
The related liability is recorded on a discounted basis, using the yield rate of 3-year and 5-year Treasury Rate, on a gross basis with a corresponding insurance receivable recognized when it is virtually certain that the reimbursement will be received and the amount of the receivable can be measured reliably. The short-term and long-term portion of the self-insurance liabilities are included in “Accrued expenses and other liabilities” and “Other long-term liabilities” in the consolidated balance sheet, respectively. The short-term and long-term portion of the insurance receivables are included in “Prepaid expenses and other assets” and “Other long-term assets” in the consolidated balance sheet, respectively.
Retirement Benefits Plans
Defined Contribution Pension Plans
The Company sponsors three defined contribution pension plans, which consist of UK stakeholder scheme, U.S. 401(K) retirement plan, and U.S. 409A non-qualified deferred compensation plan. Obligations under the Company’s defined contribution plans are recognized as an expense in the consolidated income statement as incurred.
Defined Benefit Pension Plans
The Company has a UK defined benefit plan which was closed to new members in 2001 and closed to future accrual in October 2020. The plan is a funded defined benefit plan with trustee-administered assets held separately from those of the Company. During the year ended April 30, 2024, the corporate trustee was appointed as sole trustee to the plan. The Trustees are required by law to act in the interest of all relevant beneficiaries and are responsible for the investment policy of the assets and the day-to-day administration of the benefits.
The Company’s employee pension costs and obligations under the defined benefit plans are developed from actuarial valuations. Inherent in these valuations are key assumptions, including discount rates, inflation rates, rates of increase in pensions in payment, mortality rates and other factors. The selection of assumptions is based on historical trends and known economic and market conditions at the time of valuation, as well as independent studies of trends performed by actuaries. However, actual results may differ substantially from the estimates that were based on the assumptions. The Company uses an April 30 measurement date for the plan. While management believes that the assumptions used are appropriate, significant differences in actual experience or significant changes in assumptions would affect the Company’s defined benefit pension costs and obligations.
In March 2024, the Trustees completed a buy-in transaction in relation to the Company’s defined benefit pension with the purchase of a bulk annuity policy covering the whole of the plan membership. As such, the Company now holds an insurance policy that is designed to provide cash flows that exactly match the value and timing of the benefits payable to the members it covers. Consequently, the Company is no longer exposed to investment, interest rate, inflation or life expectancy risk, or future funding requirements.
The Company reflects the funded status of defined benefit pension and other postretirement benefit plans as an asset or liability. This amount is defined as the difference between the fair value of plan assets and the benefit obligation. The Company recognizes the actuarial gains/losses as an expense in the consolidated income statement.
F-34
Table of Contents
Ashtead Group plc
Notes to Consolidated Financial Statements
Stock-Based Compensation
The Company operates a Long-Term Incentive Plan (“LTIP”), a share incentive scheme designed to reward and incentivize the most senior members of the Company. Performance stock units (“PSUs”), Sunbelt 3.0 (or “strategic plan awards”), and restricted stock units (“RSUs”) are granted for the Company’s common stock. Prior to the fiscal year ending April 30 2023, the awards were issued under the Performance Share Plan (“PSP”) which operates in a similar manner to the LTIP.
The Company measures the cost of employee services received in exchange for an award based on the grant date fair value of the award, using a Monte Carlo simulation for the awards with a market condition on Total Shareholder Return (“TSR”) or based on the market share price. Monte Carlo simulations incorporate subjective assumptions, including expected volatility based on the historical volatilities of the Company and a representative peer group of publicly traded entities. The Company accounts for all its stock-based compensation awards with or without a post-vesting holding period as equity-classified or liability-classified awards, respectively. Cost of equity-classified awards are recognized using the straight-line method over the vesting period. Cost of liability-classified awards are recognized through the consolidated income statement on the grant date and remeasured at the end of each reporting period through the date of settlement. Changes in the fair value of the liability-classified compensation awards are recorded in the consolidated income statement over the vesting period of the award. Awards are forfeited if an employee leaves the Company before vesting, unless “good leaver” status is granted. The Company recognizes forfeitures of stock-based compensation as they occur.
PSP
PSP awards were granted annually with vesting dependent on the achievement of certain market and performance conditions as well as service conditions including the employee remaining with the Company until the end of the performance period, typically three years. The market and performance conditions applicable to the awards relate to the adjusted EPS (25%), Return on Investment (“ROI”) (25%), Leverage (10%) and relative TSR (40%), which are calculated as defined in the award agreement. PSP awards were zero cost awards. PSP awards were last granted in July 2021, and no new awards will be granted under the PSP.
PSU
PSU awards are granted annually with vesting dependent on the achievement of certain market and performance conditions as well as service conditions including the employee remaining with the Company until the end of the performance period, typically three years. Some PSU awards were granted with an additional two-year post-vesting holding period. PSU awards are zero cost awards. The market and performance conditions applicable to the awards relate to the achievement which are calculated as defined in the award agreement:
| PSU awards issued during the year ended April 30, |
||||||||||||
| Market and performance conditions applicable to the awards |
2025 | 2024 | 2023 | |||||||||
| Adjusted EPS |
30 | % | 25 | % | 25 | % | ||||||
| RoI |
30 | % | 25 | % | 25 | % | ||||||
| Leverage |
N/A | 10 | % | 10 | % | |||||||
| Sustainability |
10 | % | N/A | N/A | ||||||||
| Relative TSR |
30 | % | 40 | % | 40 | % | ||||||
F-35
Table of Contents
Ashtead Group plc
Notes to Consolidated Financial Statements
Sunbelt 3.0 (or ‘Strategic Plan Award’)
Strategic Plan Awards were granted between April 2021 to December 2022 as a one-off award to coincide with the Sunbelt 3.0 strategic plan and have a vesting period of up to three years. Some Strategic Plan Awards were granted with an additional two-year post-vesting holding period. Strategic Plan Awards are zero cost awards. The performance conditions applicable to this plan are financial performance (50%), operational performance (15%), customer (15%) and environment, social and governance (“ESG”) (20%), with the performance period being three years, in line with the strategic plan. The service conditions includes the employee remaining with the Company until the end of the performance period, unless “good leaver” status is granted.
RSU
RSUs were granted in June 2024 with vesting periods ranging from one to four years, over which they vest in equal tranches. Some awards were granted with an additional one-year post-vesting holding period. Some RSUs were subject to performance conditions of RoI, dividend policy, balance sheet health, sustainability and corporate governance.
Employee Share Ownership Trust
Shares in the Company acquired by the Employee Share Ownership Trust (‘ESOT’) in the open market for use in
connection with employee share plans are presented as common stock held by the ESOT in the consolidated balance sheet. When the shares vest to satisfy share-based payments, a transfer is made from common stock held by the ESOT to retained earnings. The ESOT has waived the right to receive dividends on the shares it holds. The costs of operating the ESOT are borne by the Company but are not significant.
Income Taxes
The Company accounts for income taxes under the asset and liability method. Under this method, deferred tax assets and liabilities are recognized based upon the estimated future tax consequences attributable to differences between the financial statement carrying amount of existing assets and liabilities and their respective tax basis, as well as operating loss and tax credit carryforwards. Deferred tax assets and liabilities are measured using enacted tax rates expected to apply to taxable income in the years in which those temporary differences are expected to be recovered or settled. The effect on deferred tax assets and liabilities of a change in tax rates is recognized in income tax expense (benefit) in the period the tax rates are enacted.
The Company’s deferred tax assets are reduced by a valuation allowance if, based on the weight of available evidence, it is more likely than not (a likelihood of more than 50 percent) that some portion or all of the deferred tax assets will not be realized. The Company evaluates the realizability of deferred tax assets for each of the jurisdictions in which they operate by assessing all positive and negative evidence. This includes historical operating results, known or planned operating developments, the period of time over which certain temporary differences will reverse, consideration of the reversal of certain deferred tax liabilities, tax law carryback capability in the particular country, and prudent and feasible tax planning strategies. After evaluation of these factors, if the deferred tax assets are expected to be realized within the tax carryforward period allowed for that specific country, the Company would conclude that no valuation allowance would be required. To the extent that the deferred tax assets exceed the amount that is expected to be realized within the tax carryforward period for a particular jurisdiction, the Company establishes a valuation allowance.
The Company has historically considered the undistributed earnings of foreign subsidiaries to be indefinitely reinvested, and accordingly, no taxes have been provided on such earnings. The Company regularly reviews its
F-36
Table of Contents
Ashtead Group plc
Notes to Consolidated Financial Statements
cash position and determination of indefinite reinvestment of foreign earnings. If it is determined that all or a portion of such foreign earnings would be repatriated, we may be subject to additional foreign withholding taxes and U.S. state income taxes.
The Company recognizes benefits from tax positions only if it is more likely than not that the tax position will be sustained on examination by the taxing authorities, based on the technical merits of the positions. The tax benefits recognized in the combined financial statements from such positions are measured as the largest amount of tax benefit that is greater than 50 percent likely of being realized upon settlement. Judgment is required in evaluating tax positions and determining unrecognized tax benefits. The Company re-evaluates the technical merits of its tax positions and may recognize the benefit of a tax position in certain circumstances, including when: (1) a tax examination is completed; (2) applicable tax laws change, including through a tax case ruling or legislative guidance; or (3) the applicable statute of limitations expires. The Company recognizes interest and penalties associated with income taxes in income tax expense (benefit) in the statement of operations.
Earnings Per Share
Basic earnings per share is computed by dividing net income available to common stockholders by the weighted-average number of common shares outstanding. Diluted earnings per share is computed by dividing net income available to common stockholders by the weighted-average number of common shares plus the effect of dilutive potential common shares outstanding during the period determined using the treasury stock method.
New Accounting Pronouncements Issued but not yet adopted
Expense Disaggregation Disclosure. In November 2024, the FASB issued Accounting Standards Update No. 2024-03, “Income Statement – Reporting Comprehensive Income – Expense Disaggregation Disclosures (Subtopic 220-40)” (“ASU 2024-03”), which improves the disclosures about a public business entity’s expenses and addresses requests from investors for more detailed information about the types of expenses in commonly presented expense captions such as cost of sales, SG&A, and research and development. This ASU is effective for fiscal years beginning after December 15, 2026 and early adoption is permitted. The amendments in this ASU can be applied prospectively or retrospectively. The Company is evaluating the effect of adopting this new accounting guidance.
Recently Adopted Accounting Guidance
Improvements to Reportable Segment Disclosures. In November 2023, the FASB issued Accounting Standards Update No. 2023-07, “Segment Reporting (Topic 280): Improvements to Reportable Segment Disclosures” (“ASU 2023-07”), which is intended to improve reportable segment disclosure requirements, primarily through enhanced disclosures about significant segment expenses. The guidance is effective for fiscal years beginning after December 15, 2023, and interim periods within fiscal years beginning after December 15, 2024. Early adoption is permitted. The guidance is to be applied retrospectively to all prior periods presented in the financial statements. Upon transition, the segment expense categories and amounts disclosed in the prior periods should be based on the significant segment expense categories identified and disclosed in the period of adoption. The Company has adopted this guidance and is reflected in its consolidated financial statements and related disclosures.
Improvements to Income Tax Disclosures. In December 2023, the FASB issued Accounting Standards Update No. 2023-09, “Income Taxes (Topic 740): Improvements to Income Tax Disclosures” (“ASU 2023-09”), which modifies the rules on income tax disclosures to require entities to disclose (1) specific categories in the rate reconciliation, (2) the income or loss from continuing operations before income tax expense or benefit (separated between domestic and foreign) and (3) income tax expense or benefit from continuing operations (separated by
F-37
Table of Contents
Ashtead Group plc
Notes to Consolidated Financial Statements
federal, state and foreign). ASU 2023-09 also requires entities to disclose their income tax payments to international, federal, state and local jurisdictions, among other changes. The guidance is effective for annual periods beginning after December 15, 2024. Early adoption is permitted for annual financial statements that have not yet been issued or made available for issuance. ASU 2023-09 should be applied on a prospective basis, but retrospective application is permitted. The Company has chosen to early adopt this guidance and is reflected in its consolidated financial statements and related disclosures.
3. Revenue Recognition
Nature of goods and services
In the following table, revenue is summarized by type and by the applicable accounting standard.
| 2025 | 2024 | 2023 | ||||||||||||||||||||||||||||||||||
| (in millions) |
Topic 842 |
Topic 606 |
Total | Topic 842 |
Topic 606 |
Total | Topic 842 |
Topic 606 |
Total | |||||||||||||||||||||||||||
| Revenues: |
||||||||||||||||||||||||||||||||||||
| Equipment rentals |
$8,049 | $— | $8,049 | $7,727 | $— | $7,727 | $6,952 | $— | $6,952 | |||||||||||||||||||||||||||
| Other rental revenue: |
||||||||||||||||||||||||||||||||||||
| Delivery and pick-up |
— | 862 | 862 | — | 802 | 802 | — | 727 | 727 | |||||||||||||||||||||||||||
| Other |
338 | 731 | 1,069 | 334 | 767 | 1,101 | 312 | 707 | 1,019 | |||||||||||||||||||||||||||
|
|
|
|
|
|
|
|
|
|
|
|
|
|
|
|
|
|
|
|||||||||||||||||||
| Total equipment rentals |
8,387 | 1,593 | 9,980 | 8,061 | 1,569 | 9,630 | 7,264 | 1,434 | 8,698 | |||||||||||||||||||||||||||
| Sales of rental equipment |
— | 467 | 467 | — | 859 | 859 | — | 627 | 627 | |||||||||||||||||||||||||||
| Sales of new equipment, merchandise and consumables |
— | 344 | 344 | — | 370 | 370 | — | 342 | 342 | |||||||||||||||||||||||||||
|
|
|
|
|
|
|
|
|
|
|
|
|
|
|
|
|
|
|
|||||||||||||||||||
| Total revenues |
$8,387 | $2,404 | $10,791 | $8,061 | $2,798 | $10,859 | $7,264 | $2,403 | $9,667 | |||||||||||||||||||||||||||
|
|
|
|
|
|
|
|
|
|
|
|
|
|
|
|
|
|
|
|||||||||||||||||||
Allowance for Credit Losses
The roll forward of the allowance for credit losses is shown below.
| Year Ended April 30, | ||||||||||||
| (in millions) |
2025 | 2024 | 2023 | |||||||||
| Beginning balance |
$141 | $107 | $85 | |||||||||
| Amounts written off or recovered |
(67 | ) | (50 | ) | (25 | ) | ||||||
| Increase in allowance recognized |
28 | 84 | 47 | |||||||||
|
|
|
|
|
|
|
|||||||
| Ending balance |
$102 | $141 | $107 | |||||||||
|
|
|
|
|
|
|
|||||||
4. Acquisitions
The Company undertakes bolt-on acquisitions to complement its organic growth strategy.
2025 acquisitions
During the year, the Company completed several acquisitions that were individually immaterial. The aggregate consideration for the acquisitions was $141 million. The following table summarizes the estimated fair values of
F-38
Table of Contents
Ashtead Group plc
Notes to Consolidated Financial Statements
the assets acquired and liabilities assumed. The purchase price allocations for these assets and liabilities are based on preliminary valuations and are subject to change as we obtain additional information during the acquisition measurement period, although we do not expect material future changes.
| (in millions) |
Total | |||
| Accounts receivables |
$7 | |||
| Rental equipment |
56 | |||
| Property and equipment |
3 | |||
| Operating lease right-of-use assets |
29 | |||
| Intangible assets |
25 | |||
|
|
|
|||
| Total identifiable assets acquired |
120 | |||
|
|
|
|||
| Accounts payable, accrued expenses and other liabilities |
(3 | ) | ||
| Operating lease liabilities |
(29 | ) | ||
|
|
|
|||
| Total liabilities assumed |
(32 | ) | ||
|
|
|
|||
| Net identifiable assets acquired |
88 | |||
| Goodwill |
53 | |||
|
|
|
|||
| Net assets acquired |
$141 | |||
|
|
|
|||
The above table is inclusive of measurement period adjustments for acquisitions made during the year ended April 30, 2024 which resulted in no change to net assets acquired and a $5 million increase in goodwill.
The following table reflects the fair values and useful lives of the acquired intangible assets identified based on the purchase accounting assessments:
| (in millions) |
Fair value | Life (years) | ||||||
| Customer lists |
$25 | 15 | ||||||
The goodwill arising can be attributed to the key management personnel and workforce of the acquired businesses, the benefits through advancing the clusters and leveraging cross-selling opportunities, and to the synergies and other benefits the Company expects to derive from the acquisitions. The synergies and other benefits include elimination of duplicate costs, improving utilization of the acquired rental fleet, using the Company’s financial strength to invest in the acquired business and drive improved returns through a semi-fixed cost base and the application of the Company’s proprietary software to optimize revenue opportunities. $46 million of the goodwill is expected to be deductible for income tax purposes.
Due to the operational integration of acquired businesses post-acquisition, in particular due to the merger of some stores, the movement of rental equipment between stores and investment in the rental fleet, it is not practical to report the revenue and profit of the acquired businesses post-acquisition. The revenue and net income of these acquisitions from May 1, 2023 to their date of acquisition was not material.
F-39
Table of Contents
Ashtead Group plc
Notes to Consolidated Financial Statements
2024 acquisitions
During the year, the Company completed several acquisitions that were individually immaterial. The aggregate consideration for the acquisitions was $865 million. The following table summarizes the fair values of the assets acquired and liabilities assumed.
| (in millions) |
Total | |||
| Accounts receivables |
$44 | |||
| Inventory |
2 | |||
| Rental equipment |
441 | |||
| Property and equipment |
26 | |||
| Operating lease right-of-use assets |
113 | |||
| Intangible assets |
86 | |||
|
|
|
|||
| Total identifiable assets acquired |
712 | |||
|
|
|
|||
| Accounts payable, accrued expenses and other liabilities |
(32 | ) | ||
| Operating lease liabilities |
(113 | ) | ||
| Debt |
(55 | ) | ||
|
|
|
|||
| Total liabilities assumed |
(200 | ) | ||
|
|
|
|||
| Net identifiable assets acquired |
512 | |||
| Goodwill |
353 | |||
|
|
|
|||
| Net assets acquired |
$865 | |||
|
|
|
|||
The above table is inclusive of measurement period adjustments for acquisitions made during the year ended April 30, 2023 which resulted in no change to net assets acquired and a $30 million decrease in goodwill.
The following table reflects the fair values and useful lives of the acquired intangible assets identified based on the purchase accounting assessments:
| (in millions) |
Fair value | Life (years) | ||||||
| Customer lists |
$77 | 9 | ||||||
| Contract related |
9 | 6 | ||||||
|
|
|
|||||||
| Total |
$86 | |||||||
|
|
|
|||||||
The goodwill arising can be attributed to the key management personnel and workforce of the acquired businesses, the benefits through advancing the clusters and leveraging cross-selling opportunities, and to the synergies and other benefits the Company expects to derive from the acquisitions. The synergies and other benefits include elimination of duplicate costs, improving utilization of the acquired rental fleet, using the Company’s financial strength to invest in the acquired business and drive improved returns through a semi-fixed cost base and the application of the Company’s proprietary software to optimize revenue opportunities. $232 million of the goodwill is expected to be deductible for income tax purposes.
Due to the operational integration of acquired businesses post-acquisition, in particular due to the merger of some stores, the movement of rental equipment between stores and investment in the rental fleet, it is not practical to report the revenue and profit of the acquired businesses post-acquisition. The revenue and net income of these acquisitions from May 1, 2022 to their date of acquisition was not material.
F-40
Table of Contents
Ashtead Group plc
Notes to Consolidated Financial Statements
2023 acquisitions
During the year, the Company completed several acquisitions that were individually immaterial. The aggregate consideration for the acquisitions was $1,103 million. The following table summarizes the fair values of the assets acquired and liabilities assumed.
| (in millions) |
Total | |||
| Accounts receivables |
$54 | |||
| Inventory |
9 | |||
| Rental equipment |
411 | |||
| Property and equipment |
45 | |||
| Operating lease right-of-use assets |
147 | |||
| Intangible assets |
170 | |||
|
|
|
|||
| Total identifiable assets acquired |
836 | |||
|
|
|
|||
| Accounts payable, accrued expenses and other liabilities |
(84 | ) | ||
| Operating lease liabilities |
(145 | ) | ||
| Debt |
(78 | ) | ||
|
|
|
|||
| Total liabilities assumed |
(307 | ) | ||
|
|
|
|||
| Net identifiable assets acquired |
529 | |||
| Goodwill |
574 | |||
|
|
|
|||
| Net assets acquired |
$1,103 | |||
|
|
|
|||
The above table is inclusive of measurement period adjustments for acquisitions made during the year ended April 30, 2022 which resulted in no change to net assets acquired and a $3 million increase in goodwill.
The following table reflects the fair values and useful lives of the acquired intangible assets identified based on the purchase accounting assessments:
| (in millions) |
Fair value | Life (years) | ||||||
| Customer lists |
$166 | 8 | ||||||
| Contract related |
4 | 3 | ||||||
|
|
|
|||||||
| Total |
$170 | |||||||
|
|
|
|||||||
The goodwill arising can be attributed to the key management personnel and workforce of the acquired businesses, the benefits through advancing the clusters and leveraging cross-selling opportunities, and to the synergies and other benefits the Company expects to derive from the acquisitions. The synergies and other benefits include elimination of duplicate costs, improving utilization of the acquired rental fleet, using the Company’s financial strength to invest in the acquired business and drive improved returns through a semi-fixed cost base and the application of the Company’s proprietary software to optimize revenue opportunities. $310 million of the goodwill is expected to be deductible for income tax purposes.
Due to the operational integration of acquired businesses post-acquisition, in particular due to the merger of some stores, the movement of rental equipment between stores and investment in the rental fleet, it is not practical to report the revenue and profit of the acquired businesses post-acquisition. The revenue and net income of these acquisitions from May 1, 2022 to their date of acquisition was not material.
F-41
Table of Contents
Ashtead Group plc
Notes to Consolidated Financial Statements
5. Segment Information
The Company operates with the following three reportable and operating segments: North America – General Tool, North America – Specialty and UK, which are consistent with how the Company’s chief operating decision maker (CODM) assesses performance and allocates resources. The operating segments are determined primarily based on the nature of the products and services and the management structure of the Company. The Company’s CODM has been identified as its chief executive officer.
North America – General Tool
The North America – General Tool segment includes the rental of general construction and industrial equipment such as mobile elevating platforms, forklifts, earth moving equipment and general tool and light equipment. The segment operates predominantly across the U.S. and Canada.
North America – Specialty
The North America – Specialty segment focus on products with comparatively low rental penetration including Power & HVAC, Scaffold, Pump, Film & TV and Climate Control. The Specialty products and services are often a natural add-on to the General Tool products and services. The segment operates across the U.S. and Canada.
UK
The UK segment operates predominantly in the UK and rents a broad range of construction, industrial, general and specialty equipment.
The Company manages debt, its lease portfolio and taxation centrally, rather than by operating segments. Accordingly, segmental costs are stated excluding the impact of ASC 842 lease accounting in relation to the Company’s property leases. Furthermore, segment results are stated before interest and taxation which are reported as central Company items. This is consistent with the way the chief executive reviews the business.
Segment performance and resource allocation are evaluated by the CODM using adjusted segment operating profit. The CODM is the primary individual in control of resource allocation. The most significant allocation determinations made by the CODM using the adjusted segment operating profit relates to purchases of rental equipment, and these determinations are generally made as part of the annual budgeting process, with regular financial and operational performance reviews occurring throughout the year that can result in allocation changes (for example, if a specific segment outperforms its plan, that could result in a reallocation of resources between segments or an increase in the total allocated resources).
There are no material sales between the reportable segments. Capital expenditure represents additions to rental equipment, property and equipment, and includes additions through the acquisition of businesses. Segment assets exclude corporate assets, such as cash and cash equivalents, corporate facilities, goodwill, and other intangible assets, and tax assets.
F-42
Table of Contents
Ashtead Group plc
Notes to Consolidated Financial Statements
The following table sets forth financial information by segment for the years ended April 30, 2025, 2024 and 2023:
| North America | ||||||||||||||||
| (in millions) |
General Tool | Specialty | UK | Total | ||||||||||||
| Year ended April 30, 2025 |
||||||||||||||||
| Equipment rentals |
$5,889 | $3,313 | $778 | $9,980 | ||||||||||||
| Sales of rental equipment |
338 | 79 | 50 | 467 | ||||||||||||
| Sales of new equipment, merchandise and consumables |
170 | 95 | 79 | 344 | ||||||||||||
|
|
|
|
|
|
|
|
|
|||||||||
| Total revenues |
6,397 | 3,487 | 907 | 10,791 | ||||||||||||
| Cost of rental equipment sales |
(280 | ) | (73 | ) | (33 | ) | (386 | ) | ||||||||
| Staff costs(1) |
(1,224 | ) | (677 | ) | (258 | ) | (2,159 | ) | ||||||||
| Depreciation |
(1,384 | ) | (539 | ) | (171 | ) | (2,094 | ) | ||||||||
| Other segment items(2) |
(1,416 | ) | (1,060 | ) | (372 | ) | (2,848 | ) | ||||||||
|
|
|
|
|
|
|
|
|
|||||||||
| Adjusted Segment Operating profit |
2,093 | 1,138 | 73 | 3,304 | ||||||||||||
| Reconciliation of Adjusted Segment Operating Profit to income before provision for income taxes: |
||||||||||||||||
| Central costs(3) |
(695 | ) | ||||||||||||||
| Interest expense, net |
(425 | ) | ||||||||||||||
| Amortization of acquired intangibles |
(114 | ) | ||||||||||||||
|
|
|
|||||||||||||||
| Income before provision for income taxes |
$2,070 | |||||||||||||||
|
|
|
|||||||||||||||
| Capital expenditures |
1,736 | 537 | 187 | 2,460 | ||||||||||||
| Segment assets |
10,083 | 3,623 | 1,198 | 14,904 | ||||||||||||
| Corporate |
7,066 | |||||||||||||||
|
|
|
|||||||||||||||
| Total assets |
$21,970 | |||||||||||||||
| Year ended April 30, 2024 |
||||||||||||||||
| Equipment rentals |
$5,826 | $3,062 | $742 | $9,630 | ||||||||||||
| Sales of rental equipment |
721 | 73 | 65 | 859 | ||||||||||||
| Sales of new equipment, merchandise and consumables |
174 | 115 | 81 | 370 | ||||||||||||
|
|
|
|
|
|
|
|
|
|||||||||
| Total revenues |
6,721 | 3,250 | 888 | 10,859 | ||||||||||||
| Cost of rental equipment sales |
(530 | ) | (66 | ) | (40 | ) | (636 | ) | ||||||||
| Staff costs(1) |
(1,199 | ) | (696 | ) | (267 | ) | (2,162 | ) | ||||||||
| Depreciation |
(1,259 | ) | (470 | ) | (164 | ) | (1,893 | ) | ||||||||
| Other segment items(2) |
(1,339 | ) | (1,054 | ) | (364 | ) | (2,757 | ) | ||||||||
|
|
|
|
|
|
|
|
|
|||||||||
| Adjusted Segment Operating Profit |
2,394 | 964 | 53 | 3,411 | ||||||||||||
| Reconciliation of Adjusted Segment Operating Profit to income before provision for income taxes: |
||||||||||||||||
| Central costs(3) |
(768 | ) | ||||||||||||||
| Interest (income) expense, net |
(428 | ) | ||||||||||||||
| Amortization of acquired intangibles |
(121 | ) | ||||||||||||||
|
|
|
|||||||||||||||
| Income before provision for income taxes |
$2,094 | |||||||||||||||
|
|
|
|||||||||||||||
| Capital expenditures |
3,219 | 1,180 | 266 | 4,665 | ||||||||||||
| Segment assets |
10,017 | 3,747 | 1,163 | 14,927 | ||||||||||||
F-43
Table of Contents
Ashtead Group plc
Notes to Consolidated Financial Statements
| North America | ||||||||||||||||
| (in millions) |
General Tool | Specialty | UK | Total | ||||||||||||
| Corporate |
6,957 | |||||||||||||||
|
|
|
|||||||||||||||
| Total assets |
$21,884 | |||||||||||||||
| Year ended April 30, 2023 |
||||||||||||||||
| Equipment rentals |
$5,292 | $2,734 | $672 | $8,698 | ||||||||||||
| Sales of rental equipment |
512 | 53 | 62 | 627 | ||||||||||||
| Sales of new equipment, merchandise and consumables |
152 | 101 | 89 | 342 | ||||||||||||
|
|
|
|
|
|
|
|
|
|||||||||
| Total revenues |
5,956 | 2,888 | 823 | 9,667 | ||||||||||||
| Cost of rental equipment sales |
(360 | ) | (44 | ) | (38 | ) | (442 | ) | ||||||||
| Staff costs(1) |
(1,081 | ) | (597 | ) | (217 | ) | (1,895 | ) | ||||||||
| Depreciation |
(1,070 | ) | (365 | ) | (142 | ) | (1,577 | ) | ||||||||
| Other segment items(2) |
(1,231 | ) | (954 | ) | (348 | ) | (2,533 | ) | ||||||||
|
|
|
|
|
|
|
|
|
|||||||||
| Adjusted Segment Operating Profit |
2,214 | 928 | 78 | 3,220 | ||||||||||||
| Reconciliation of Adjusted Segment Operating Profit to income before provision for income taxes: |
||||||||||||||||
| Central costs(3) |
(675 | ) | ||||||||||||||
| Interest (income) expense, net |
(275 | ) | ||||||||||||||
| Amortization of acquired intangibles |
(118 | ) | ||||||||||||||
|
|
|
|||||||||||||||
| Income before provision for income taxes |
$2,152 | |||||||||||||||
|
|
|
|||||||||||||||
| Capital expenditures |
2,869 | 1,019 | 261 | 4,149 | ||||||||||||
| Segment assets |
8,580 | 3,007 | 1,090 | 12,677 | ||||||||||||
| Corporate |
6,170 | |||||||||||||||
|
|
|
|||||||||||||||
| Total assets |
$18,847 | |||||||||||||||
| (1) | Staff costs comprise of salaries and related benefits and pension costs. |
| (2) | Other segment items comprise of spares, vehicle, facility and other miscellaneous costs. |
| (3) | Central costs comprise of corporate costs incurred to run the business as a whole including costs associated with the Company’s support functions, technology expenditure and the accounting adjustment to reflect ASC 842 lease accounting in relation to the Company’s property leases. |
The Company’s operations are located in the United States, Canada and the United Kingdom. Revenue by geographic region is allocated to individual countries based on the location of stores. The following table presents geographic area information for the years ended April 30, 2025, 2024 and 2023:
| (in millions) |
United States |
Canada | United Kingdom |
Total | ||||||||||||
| 2025 |
||||||||||||||||
| Equipment rentals |
$8,587 | $615 | $778 | $9,980 | ||||||||||||
| Sales of rental equipment |
384 | 33 | 50 | 467 | ||||||||||||
| Sales of new equipment, merchandise and consumables |
233 | 32 | 79 | 344 | ||||||||||||
|
|
|
|
|
|
|
|
|
|||||||||
| Total revenue |
$9,204 | $680 | $907 | $10,791 | ||||||||||||
|
|
|
|
|
|
|
|
|
|||||||||
| Rental equipment, net |
$9,759 | $765 | $816 | $11,340 | ||||||||||||
| Property and equipment, net |
$1,688 | $169 | $181 | $2,038 | ||||||||||||
| 2024 |
||||||||||||||||
| Equipment rentals |
$8,321 | $567 | $742 | $9,630 | ||||||||||||
F-44
Table of Contents
Ashtead Group plc
Notes to Consolidated Financial Statements
| (in millions) |
United States |
Canada | United Kingdom |
Total | ||||||||||||
| Sales of rental equipment |
742 | 52 | 65 | 859 | ||||||||||||
| Sales of new equipment, merchandise and consumables |
244 | 45 | 81 | 370 | ||||||||||||
|
|
|
|
|
|
|
|
|
|||||||||
| Total revenue |
$9,307 | $664 | $888 | $10,859 | ||||||||||||
|
|
|
|
|
|
|
|
|
|||||||||
| Rental equipment, net |
$9,921 | $755 | $789 | $11,465 | ||||||||||||
| Property and equipment, net |
$1,591 | $159 | $161 | $1,911 | ||||||||||||
| 2023 |
||||||||||||||||
| Equipment rentals |
$7,502 | $524 | $672 | $8,698 | ||||||||||||
| Sales of rental equipment |
533 | 32 | 62 | 627 | ||||||||||||
| Sales of new equipment, merchandise and consumables |
187 | 66 | 89 | 342 | ||||||||||||
|
|
|
|
|
|
|
|
|
|||||||||
| Total revenue |
$8,222 | $622 | $823 | $9,667 | ||||||||||||
|
|
|
|
|
|
|
|
|
|||||||||
| Rental equipment, net |
$8,323 | $588 | $738 | $9,649 | ||||||||||||
| Property and equipment, net |
$1,265 | $111 | $133 | $1,509 | ||||||||||||
6. Inventory
Inventory consists of the following:
| As of April 30, | ||||||||||||
| (in millions) |
2025 | 2024 | 2023 | |||||||||
| Raw materials, consumables and spares |
$75 | $87 | $102 | |||||||||
| Goods for resale |
72 | 75 | 79 | |||||||||
|
|
|
|
|
|
|
|||||||
| Inventory |
$147 | $162 | $181 | |||||||||
|
|
|
|
|
|
|
|||||||
7. Rental Equipment, net
Rental equipment consists of the following:
| As of April 30, | ||||||||||||
| (in millions) |
2025 | 2024 | 2023 | |||||||||
| Rental equipment |
$18,567 | $17,759 | $15,826 | |||||||||
| Less: accumulated depreciation |
(7,227 | ) | (6,294 | ) | (6,177 | ) | ||||||
|
|
|
|
|
|
|
|||||||
| Rental equipment, net |
$11,340 | $11,465 | $9,649 | |||||||||
|
|
|
|
|
|
|
|||||||
Amounts due but unpaid for purchases of rental equipment was $225 million, $512 million and $606 million as of April 30, 2025, 2024 and 2023, respectively. These balances are included in “Accounts payable” and “Accrued expenses and other liabilities” in the consolidated balance sheet. Amounts receivable but unpaid for sales of rental equipment was $99 million, $111 million and $110 million as of April 30, 2025, 2024 and 2023, respectively.
F-45
Table of Contents
Ashtead Group plc
Notes to Consolidated Financial Statements
8. Property and Equipment, net
Property, plant and equipment, net consists of the following:
| As of April 30, | ||||||||||||
| (in millions) |
2025 | 2024 | 2023 | |||||||||
| Land and buildings |
$1,252 | $1,120 | $863 | |||||||||
| Motor vehicles |
1,541 | 1,451 | 1,254 | |||||||||
| Office and workshop equipment |
548 | 494 | 405 | |||||||||
|
|
|
|
|
|
|
|||||||
| Property and equipment |
3,341 | 3,065 | 2,522 | |||||||||
| Less: accumulated depreciation |
(1,303 | ) | (1,154 | ) | (1,013 | ) | ||||||
|
|
|
|
|
|
|
|||||||
| Property and equipment, net |
$2,038 | $1,911 | $1,509 | |||||||||
|
|
|
|
|
|
|
|||||||
Depreciation expense was $301 million, $258 million and $201 million for the years ended April 30, 2025, 2024 and 2023, respectively, and is included in “Non-rental depreciation and amortization” in the Company’s consolidated statements of income.
9. Goodwill and Other Intangible Assets
The following table presents the changes in the carrying amount of goodwill for each of the three years in the period ended April 30, 2025:
| North America | ||||||||||||||||
| (in millions) | General Tool |
Specialty | United Kingdom |
Total | ||||||||||||
| Balance as of May 1, 2022 |
$1,476 | $751 | $143 | $2,370 | ||||||||||||
| Goodwill related to acquisitions |
298 | 172 | 104 | 574 | ||||||||||||
| Foreign currency translation |
(9 | ) | (6 | ) | 6 | (9 | ) | |||||||||
|
|
|
|
|
|
|
|
|
|||||||||
| Balance as of May 1, 2023 |
1,765 | 917 | 253 | 2,935 | ||||||||||||
| Goodwill related to acquisitions |
219 | 131 | 3 | 353 | ||||||||||||
| Foreign currency translation |
(3 | ) | (4 | ) | (1 | ) | (8 | ) | ||||||||
|
|
|
|
|
|
|
|
|
|||||||||
| Balance as of April 30, 2024 |
1,981 | 1,044 | 255 | 3,280 | ||||||||||||
| Goodwill related to acquisitions |
46 | 1 | 6 | 53 | ||||||||||||
| Foreign currency translation |
(2 | ) | (1 | ) | 18 | 15 | ||||||||||
|
|
|
|
|
|
|
|
|
|||||||||
| Balance as of April 30, 2025 |
$2,025 | $1,044 | $279 | $3,348 | ||||||||||||
|
|
|
|
|
|
|
|
|
|||||||||
Other intangible assets were comprised of the following:
| As of April 30, 2025 | ||||||||||||||||
| (in millions) |
Weighted- Average Remaining Amortization Period |
Gross Carrying Amount |
Accumulated Amortization |
Net Amount |
||||||||||||
| Customer lists |
6 | $1,161 | $(772 | ) | $389 | |||||||||||
| Contract related |
4 | 124 | (115 | ) | 9 | |||||||||||
| Internal use software |
2 | 104 | (69 | ) | 35 | |||||||||||
| Brand names |
— | 30 | (30 | ) | — | |||||||||||
|
|
|
|
|
|
|
|||||||||||
| Total |
$1,419 | $(986 | ) | $433 | ||||||||||||
|
|
|
|
|
|
|
|||||||||||
F-46
Table of Contents
Ashtead Group plc
Notes to Consolidated Financial Statements
| As of April 30, 2024 | ||||||||||||||||
| (in millions) |
Weighted- Average Remaining Amortization Period |
Gross Carrying Amount |
Accumulated Amortization |
Net Amount |
||||||||||||
| Customer lists |
6 | $1,130 | $(656 | ) | $474 | |||||||||||
| Contract related |
4 | 122 | (110 | ) | 12 | |||||||||||
| Internal use software |
3 | 125 | (85 | ) | 40 | |||||||||||
| Brand names |
— | 29 | (29 | ) | — | |||||||||||
|
|
|
|
|
|
|
|||||||||||
| Total |
$1,406 | $(880 | ) | $526 | ||||||||||||
|
|
|
|
|
|
|
|||||||||||
| As of April 30, 2023 | ||||||||||||||||
| (in millions) |
Weighted- Average Remaining Amortization Period |
Gross Carrying Amount |
Accumulated Amortization |
Net Amount |
||||||||||||
| Customer lists |
6 | $1,058 | $(543 | ) | $515 | |||||||||||
| Contract related |
3 | 113 | (105 | ) | 8 | |||||||||||
| Internal use software |
3 | 97 | (70 | ) | 27 | |||||||||||
| Brand names |
— | 29 | (29 | ) | — | |||||||||||
|
|
|
|
|
|
|
|||||||||||
| Total |
$1,297 | $(747 | ) | $550 | ||||||||||||
|
|
|
|
|
|
|
|||||||||||
Amortization expense on other intangible assets was $135 million, $136 million and $133 million for the years ended April 30, 2025, 2024 and 2023, respectively.
As of April 30, 2025, estimated amortization expense for other intangible assets for each of the next five years and thereafter was as follows:
| Year-ending April 30 |
Total (in millions) |
|||
| 2026 |
$129 | |||
| 2027 |
103 | |||
| 2028 |
58 | |||
| 2029 |
40 | |||
| 2030 |
32 | |||
| Thereafter |
71 | |||
|
|
|
|||
| Total |
$433 | |||
|
|
|
|||
10. Accrued expenses and other liabilities
Accrued expenses and other liabilities consist of the following:
| April 30, | ||||||||||||
| (in millions) | 2025 | 2024 | 2023 | |||||||||
| Accrued compensation and benefit costs |
$ | 298 | $ | 396 | $ | 336 | ||||||
| Customer rebates |
101 | 83 | 80 | |||||||||
| Deferred revenue |
75 | 74 | 75 | |||||||||
| Accrued interest |
72 | 83 | 62 | |||||||||
F-47
Table of Contents
Ashtead Group plc
Notes to Consolidated Financial Statements
| April 30, | ||||||||||||
| (in millions) | 2025 | 2024 | 2023 | |||||||||
| Accrued capital expenditure |
$ | 61 | $ | 124 | $ | 169 | ||||||
| Operating expenses and other (1) |
384 | 382 | 355 | |||||||||
|
|
|
|
|
|
|
|||||||
| Accrued expenses and other liabilities |
$ | 991 | $ | 1,142 | $ | 1,077 | ||||||
|
|
|
|
|
|
|
|||||||
| (1) | “Operating expenses and other” is comprised of finance lease liabilities and various accounts payable accruals pertaining to professional fees, utilities and administrative expenses, which are individually immaterial. |
11. Insurance Provisions
As of April 30, 2025, estimated payments for insurance provisions for each of the next five years and thereafter was as follows:
| Expected payments for insurance provisions (in millions) |
||||
| For the year ending 30 April, |
||||
| 2026 |
$59 | |||
| 2027 |
41 | |||
| 2028 |
28 | |||
| 2029 |
18 | |||
| 2030 |
10 | |||
| Thereafter |
23 | |||
|
|
|
|||
| Total |
179 | |||
|
|
|
|||
| Less amount representing interest |
(20 | ) | ||
|
|
|
|||
| Insurance provisions |
$159 | |||
|
|
|
|||
12. Fair Value Measurements
The carrying amounts reported in the consolidated balance sheets for cash, accounts receivable, accounts payable and accrued expenses and other liabilities approximate fair value due to the immediate to short-term maturity of these financial instruments. The fair values of the first priority senior secured credit facility and finance leases approximated their book values as of April 30, 2025, 2024 and 2023. The estimated fair values of the other financial instruments were as follows:
| As of April 30, 2025 | As of April 30, 2024 | As of April 30, 2023 | ||||||||||||||||||||||||||
| (in millions) |
Carrying Amount |
Fair Value |
Carrying Amount |
Fair Value |
Carrying amount |
Fair Value |
||||||||||||||||||||||
| Senior notes |
Level 1 | $6,154 | $6,018 | $6,147 | $5,783 | $4,557 | $4,257 | |||||||||||||||||||||
| Contingent consideration |
Level 3 | 18 | 18 | 31 | 31 | 47 | 47 | |||||||||||||||||||||
| Equity investments |
Level 3 | 32 | 32 | 57 | 57 | 41 | 41 | |||||||||||||||||||||
The senior notes are carried at amortized cost and the contingent consideration and equity investments are carried at fair value in the consolidated balance sheets.
Contingent consideration relates to recent acquisitions and is based on the post-acquisition performance of the acquired businesses. The consideration is expected to be paid out over the next five years and is reassessed at each reporting date.
F-48
Table of Contents
Ashtead Group plc
Notes to Consolidated Financial Statements
Contingent consideration is a Level 3 financial liability. Future anticipated payments in respect of contingent consideration are initially recorded at fair value which is the present value of the expected cash outflows of the obligations. The obligations are dependent upon the future financial performance of the businesses acquired. The fair value is estimated based on internal financial projections prepared in relation to the acquisition with the contingent consideration discounted to present value using a discount rate in line with the Company’s cost of debt. Details of the movement in the fair value during the year are as follows:
| As of April 30, | ||||||||||||
| (in millions) |
2025 | 2024 | 2023 | |||||||||
| Beginning Balance |
$31 | $47 | $33 | |||||||||
| Acquired businesses |
4 | 16 | 36 | |||||||||
| Foreign exchange movement |
— | (2 | ) | 2 | ||||||||
| Settled |
(13 | ) | (30 | ) | (22 | ) | ||||||
| Released |
(5 | ) | (1 | ) | (3 | ) | ||||||
| Amortization of discount |
1 | 1 | 1 | |||||||||
|
|
|
|
|
|
|
|||||||
| Ending Balance |
$18 | $31 | $47 | |||||||||
|
|
|
|
|
|
|
|||||||
Equity investments are measured at fair value and are Level 3 financial assets. These assets are measured at fair value through net income. Their fair values are estimated based on the latest transaction price and any subsequent investment-specific adjustments. Details of the movement in the fair value during the year are as follows:
| As of April 30, | ||||||||||||
| (in millions) |
2025 | 2024 | 2023 | |||||||||
| Beginning Balance |
$57 | $41 | $40 | |||||||||
| Additions |
— | 15 | 42 | |||||||||
| Interest |
— | 1 | 1 | |||||||||
| Loss for the year |
(25 | ) | — | (42 | ) | |||||||
|
|
|
|
|
|
|
|||||||
| Ending Balance |
$32 | $57 | $41 | |||||||||
|
|
|
|
|
|
|
|||||||
Equity investments are included in “Other long-term assets” in the consolidated balance sheet.
13. Debt
Debt, net of unamortized original issue premiums and unamortized debt issuance costs, consists of the following:
| As of April 30, | ||||||||||||
| (in millions) |
2025 | 2024 | 2023 | |||||||||
| First priority senior secured bank debt |
$1,346 | $1,848 | $2,038 | |||||||||
| 1.500% senior notes, due August 2026 |
549 | 548 | 547 | |||||||||
| 4.375% senior notes, due August 2027 |
598 | 597 | 596 | |||||||||
| 4.000% senior notes, due May 2028 |
597 | 596 | 595 | |||||||||
| 4.250% senior notes, due November 2029 |
596 | 595 | 594 | |||||||||
| 2.450% senior notes, due August 2031 |
745 | 745 | 744 | |||||||||
| 5.500% senior notes, due August 2032 |
740 | 739 | 738 | |||||||||
| 5.550% senior notes, due May 2033 |
744 | 743 | 743 | |||||||||
| 5.950% senior notes, due October 2033 |
744 | 744 | — | |||||||||
| 5.800% senior notes, due April 2034 |
841 | 840 | — | |||||||||
|
|
|
|
|
|
|
|||||||
| Total long-term debt |
$7,500 | $7,995 | $6,595 | |||||||||
|
|
|
|
|
|
|
|||||||
F-49
Table of Contents
Ashtead Group plc
Notes to Consolidated Financial Statements
First priority senior secured credit facility
As of April 30, 2025, $4,750 million was committed by the senior lenders under the asset-based senior secured revolving credit facility (‘ABL facility’) until November 2029. The amount utilized was $1,351 million (including letters of credit totaling $5 million). The ABL facility is secured by a first priority interest in substantially all of the Company’s assets. Pricing for the $4,750 million revolving credit facility is based on average availability according to a grid, varying from the applicable interest rate plus 125bp to 137.5bp. The applicable interest rate is based on Secured Overnight Financing Rate (“SOFR”) for U.S. dollar loans, Canadian Dollar Offered Rate (“CDOR”) for Canadian dollar loans and Sterling Overnight Interbank Average (“SONIA”) for sterling loans. The borrowing rate was the applicable interest rate plus 125 basis points and the weighted average interest rate was 5.242%, 6.853% and 6.414% as of April 30, 2025, 2024 and 2023, respectively.
The only financial performance covenant under the asset-based first priority senior bank facility is a fixed charge ratio (comprising last 12-month (“LTM”) Earnings before interest, taxes, depreciation, and amortization (“EBITDA”) before exceptional items less LTM net capital expenditure paid in cash over the sum of scheduled debt repayments plus cash interest, cash tax payments and dividends paid in the last 12 months) which must be equal to or greater than 1.0 times.
This covenant does not, however, apply when availability (the difference between the borrowing base and facility utilization) exceeds $475 million. Availability under the bank facility for covenant purposes was $3,616 million, $2,771 million and $2,573 million as of April 30, 2025, 2024 and 2023, respectively, meaning that the covenant was not measured for the periods presented and is unlikely to be measured in forthcoming quarters.
Senior notes
The senior notes are guaranteed by Ashtead Group plc and all material direct and indirect subsidiaries (“the guarantors”). The senior notes and the related guarantees rank senior in right of payment with all of the guarantors’ existing and future debt that is subordinated in right of payment to the senior notes and the guarantees and rank equally in right of payment with all of the guarantors’ existing and future debt that is not subordinated in right of payment to the senior notes and the guarantees. The senior notes are effectively subordinated to all of the guarantors’ existing and future secured debt, including the First Priority Senior Secured Credit Facility, to the extent of the value of the collateral securing such debt, and structurally subordinated to all of the liabilities of the subsidiaries that do not guarantee the senior notes. The indentures governing the senior notes contains certain covenants including limitations the creation of liens to secure debt, the entrance into sales and lease back transactions, and the sale of all or substantially all of its properties and assets or the merger and consolidation with or into another company. The covenants are subject to important exceptions and qualifications. Upon the occurrence of certain events constituting a change of control or change of control triggering event, as defined in the applicable indenture, the Company is required to offer to purchase the notes at a purchase price equal to 101% of their principal amount, plus accrued and unpaid interest, if any, to, but not including, the repurchase date. The embedded prepayment options included within the senior notes are either closely related to the host debt contract or immaterial, and are not accounted for separately.
As of April 30, 2025 the Company, through its wholly owned subsidiary Ashtead Capital, Inc., had nine series of senior notes outstanding as follows.
$550 million 1.500% senior notes due 2026. On August 12, 2021, the Company issued $550 million principal amount of 1.500% Senior Notes which are due August 12, 2026. Interest on the notes is payable on February 12 and August 12 of each year, beginning on February 12, 2022. The Company may redeem the notes, in whole or in part, at any time prior to July 12, 2026 (one month prior to the maturity date), at a redemption price equal to
F-50
Table of Contents
Ashtead Group plc
Notes to Consolidated Financial Statements
100% of the principal amount of the notes to be redeemed plus the applicable make-whole premium, plus accrued and unpaid interest, if any, to but excluding the date of redemption. In addition, at any time after July 12, 2026, the Company may redeem the notes, in whole or in part, at a redemption price equal to 100% of the principal amount of the notes to be redeemed, plus accrued and unpaid interest, if any, to the date of redemption on the principal amount of the notes to be redeemed.
$600 million 4.375% senior notes due 2027. On August 9, 2017, the Company issued $600 million principal amount of 4.375% Senior Notes which are due August 15, 2027. Interest on the notes is payable on February 15 and August 15 of each year, beginning on February 15, 2018. The Company may redeem the notes, in whole or in part, at any time prior to August 15, 2022 by paying the applicable make-whole premium plus accrued and unpaid interest, if any, to the date of redemption. On or after August 15, 2022, the Company may redeem the notes at the applicable redemption prices plus accrued and unpaid interest, if any, to the date of redemption. In addition, prior to August 15, 2020, the Company may redeem up to 40% of the notes from the proceeds of certain equity offerings.
$600 million 4.000% senior notes due 2028. On November 4, 2019, the Company issued $600 million principal amount of 4.000% Senior Notes which are due May 1, 2028. Interest on the notes is payable on May 1 and November 1 of each year, beginning on May 1, 2020. The Company may redeem the notes, in whole or in part, at any time prior to May 1, 2023 by paying the applicable make-whole premium plus accrued and unpaid interest, if any, to the date of redemption. On or after May 1, 2023, the Company may redeem the notes at the applicable redemption prices plus accrued and unpaid interest, if any, to the date of redemption. In addition, prior to May 1, 2022, the Company may redeem up to 40% of the notes from the proceeds of certain equity offerings.
$600 million 4.250% senior notes due 2029. On November 4, 2019, the Company issued $600 million principal amount of 4.250% Senior Notes which are due November 1, 2029. Interest on the notes is payable on May 1 and November 1 of each year, beginning on May 1, 2020. The Company may redeem the notes, in whole or in part, at any time prior to November 1, 2024 by paying the applicable make-whole premium plus accrued and unpaid interest, if any, to the date of redemption. On or after November 1, 2024, the Company may redeem the notes at the applicable redemption prices plus accrued and unpaid interest, if any, to the date of redemption. In addition, prior to November 1, 2022, the Company may redeem up to 40% of the notes from the proceeds of certain equity offerings.
$750 million 2.450% senior notes due 2031. On August 12, 2021, the Company issued $750 million principal amount of 2.450% Senior Notes which are due August 12, 2031. Interest on the notes is payable on February 12 and August 12 of each year, beginning on February 12, 2022. The Company may redeem the notes, in whole or in part, at any time prior to May 12, 2031 (three months prior to the maturity date), at a redemption price equal to 100% of the principal amount of the notes to be redeemed plus the applicable make-whole premium, plus accrued and unpaid interest, if any, to but excluding the date of redemption. In addition, at any time after May 12, 2031, the Company may redeem the notes, in whole or in part, at a redemption price equal to 100% of the principal amount of the notes to be redeemed, plus accrued and unpaid interest, if any, to the date of redemption on the principal amount of the notes to be redeemed.
$750 million 5.500% senior notes due 2032. On August 11, 2022, the Company issued $750 million principal amount of 5.500% Senior Notes which are due August 12, 2032. Interest on the notes is payable on February 11 and August 11 of each year, beginning on February 11, 2023. The Company may redeem the Notes, in whole or in part, at any time prior to May 11, 2032 (three months prior to the maturity date), at a redemption price equal to 100% of the principal amount of the notes to be redeemed plus the applicable make-whole premium, plus accrued and unpaid interest, if any, to but excluding the date of redemption. In addition, at any time after May 11, 2032, the Company may redeem the notes, in whole or in part, at a redemption price equal to 100% of the principal amount of the notes to be redeemed, plus accrued and unpaid interest, if any, to the date of redemption on the principal amount of the notes to be redeemed.
F-51
Table of Contents
Ashtead Group plc
Notes to Consolidated Financial Statements
$750 million 5.550% senior notes due 2033. On January 30, 2023, the Company issued $750 million principal amount of 5.550% Senior Notes which are due May 30, 2033. Interest on the notes is payable on May 30 and November 30 of each year, beginning on May 30, 2023. The Company may redeem the notes, in whole or in part, at any time prior to February 28, 2033 (three months prior to the maturity date), at a redemption price equal to 100% of the principal amount of the notes to be redeemed plus the applicable make-whole premium, plus accrued and unpaid interest, if any, to but excluding the date of redemption. In addition, at any time after February 28, 2033, the Company may redeem the notes, in whole or in part, at a redemption price equal to 100% of the principal amount of the notes to be redeemed, plus accrued and unpaid interest, if any, to the date of redemption on the principal amount of the notes to be redeemed.
$750 million 5.950% senior notes due 2033. On July 27, 2023, the Company issued $750 million principal amount of 5.950% Senior Notes which are due October 15, 2033. Interest on the notes is payable on April 15 and October 15 of each year, beginning on October 15, 2023. The Company may redeem the notes, in whole or in part, at any time prior to July 15, 2033 (three months prior to the maturity date), at a redemption price equal to 100% of the principal amount of the notes to be redeemed plus the applicable make-whole premium, plus accrued and unpaid interest, if any, to but excluding the date of redemption. In addition, at any time on or after July 15, 2033, the Company may redeem the notes, in whole or in part, at a redemption price equal to 100% of the principal amount of the notes to be redeemed, plus accrued and unpaid interest, if any, to the date of redemption on the principal amount of the notes to be redeemed.
$850 million 5.800% senior notes due 2034. On January 29, 2024, the Company issued $850 million principal amount of 5.800% Senior Notes which are due April 15, 2034. Interest on the notes is payable on April 15 and October 15 of each year, beginning on October 15, 2024. The Company may redeem the notes, in whole or in part, at any time prior to January 15, 2034 (three months prior to the maturity date), at a redemption price equal to 100% of the principal amount of the notes to be redeemed plus the applicable make-whole premium, plus accrued and unpaid interest, if any, to but excluding the date of redemption. In addition, at any time after January 15, 2034, the Company may redeem the notes, in whole or in part, at a redemption price equal to 100% of the principal amount of the notes to be redeemed, plus accrued and unpaid interest, if any, to the date of redemption on the principal amount of the notes to be redeemed.
Maturities
Debt maturities (exclusive of an unamortized original issue premiums and unamortized debt costs) for each of the next five years and thereafter as of April 30, 2025 (in millions):
| For the year ending 30 April, |
||||
| 2026 |
$— | |||
| 2027 |
549 | |||
| 2028 |
598 | |||
| 2029 |
597 | |||
| 2030 |
1,942 | |||
| Thereafter |
3,814 | |||
|
|
|
|||
| Total |
$7,500 | |||
|
|
|
14. Leases
The Company leases a significant portion of the branch locations, and also lease other premises used for purposes such as district and regional offices and support office centers. The finance lease obligations consist of vehicles and building leases.
F-52
Table of Contents
Ashtead Group plc
Notes to Consolidated Financial Statements
The tables below present financial information associated with the lease balances and related expenses for the years ended April 30, 2025, 2024 and 2023.
|
|
Year Ended April 30, | |||||||||||||
| (in millions) |
Classification |
2025 | 2024 | 2023 | ||||||||||
| Assets |
||||||||||||||
| Operating lease assets |
Operating lease right-of-use assets | $2,523 | $2,403 | $2,107 | ||||||||||
| Finance lease assets |
Property and equipment, net: | |||||||||||||
| Non-rental vehicles |
52 | 48 | 28 | |||||||||||
| Property |
142 | 133 | 134 | |||||||||||
| Less: accumulated amortization |
(40 | ) | (28 | ) | (18 | ) | ||||||||
|
|
|
|
|
|
|
|||||||||
| Total lease assets |
$2,677 | $2,556 | $2,251 | |||||||||||
|
|
|
|
|
|
|
|||||||||
| Liabilities |
||||||||||||||
| Current |
||||||||||||||
| Operating |
Operating lease liabilities | $266 | $249 | $217 | ||||||||||
| Finance |
Accrued expenses and other liabilities | 7 | 6 | 6 | ||||||||||
| Long-term |
||||||||||||||
| Operating |
Non-current portion of operating lease liabilities | 2,434 | 2,311 | 2,026 | ||||||||||
| Finance |
Other long-term liabilities | 169 | 166 | 150 | ||||||||||
|
|
|
|
|
|
|
|||||||||
| Total lease liabilities |
$2,876 | $2,732 | $2,399 | |||||||||||
|
|
|
|
|
|
|
|||||||||
| Year Ended April 30, | ||||||||||||||
| (in millions) |
Classification |
2025 | 2024 | 2023 | ||||||||||
| Operating lease cost(1) |
Cost of equipment rentals, excluding depreciation | $300 | $277 | $230 | ||||||||||
| Selling, general and administrative expense | 14 | 12 | 10 | |||||||||||
| Finance lease cost |
||||||||||||||
| Amortization of ROU assets |
Non-rental depreciation and amortization | 14 | 12 | 8 | ||||||||||
| Interest on lease liabilities |
Interest expense, net | 9 | 7 | 6 | ||||||||||
| Sublease income |
Equipment rental revenue | (12 | ) | (12 | ) | (28 | ) | |||||||
|
|
|
|
|
|
|
|||||||||
| Net lease cost |
$325 | $296 | $226 | |||||||||||
|
|
|
|
|
|
|
|||||||||
| (1) | Includes variable lease costs of $25 million, $25 million and $21 million for the years ended April 30, 2025, 2024 and 2023, respectively, and short term lease costs associated with equipment that the Company rents from vendors and then rent to its customers of $1 million, $2 million and $2 million for the years ended April 30, 2025, 2024 and 2023, respectively. |
| As of April 30, | ||||||||||||
| Lease term and discount rate |
2025 | 2024 | 2023 | |||||||||
| Weighted-average remaining lease term (years) |
||||||||||||
| Operating leases |
15 | 15 | 15 | |||||||||
| Finance leases |
21 | 21 | 24 | |||||||||
| Weighted-average discount rate |
||||||||||||
| Operating leases |
5.21 | % | 5.05 | % | 4.65 | % | ||||||
| Finance leases |
4.12 | % | 4.03 | % | 3.89 | % | ||||||
F-53
Table of Contents
Ashtead Group plc
Notes to Consolidated Financial Statements
| Year Ended April 30, | ||||||||||||
| (in millions) |
2025 | 2024 | 2023 | |||||||||
| Cash paid for amounts included in the measurement of lease liabilities: |
||||||||||||
| Operating cash flows from operating leases |
$268 | $243 | $200 | |||||||||
| Operating cash flows from finance leases |
9 | 7 | 6 | |||||||||
| Financing cash flows from finance leases |
18 | 12 | 8 | |||||||||
| Lease assets obtained in exchange for new operating lease liabilities |
227 | 385 | 366 | |||||||||
| Lease assets obtained in exchange for new finance lease liabilities |
17 | 22 | 10 | |||||||||
| Maturity of lease liabilities as of April 30, 2025 (in millions) |
Operating leases |
Finance leases |
||||||
| 2026 |
$277 | $23 | ||||||
| 2027 |
276 | 19 | ||||||
| 2028 |
272 | 15 | ||||||
| 2029 |
267 | 11 | ||||||
| 2030 |
264 | 9 | ||||||
| Thereafter |
2,695 | 185 | ||||||
|
|
|
|
|
|||||
| Total |
4,051 | 262 | ||||||
| Less amount representing interest |
(1,351 | ) | (86 | ) | ||||
|
|
|
|
|
|||||
| Present value of lease liabilities |
$2,700 | $176 | ||||||
|
|
|
|
|
|||||
15. Income Taxes
The components of income before provision (benefit) for income taxes for each of the three years in the period ended April 30, 2025 are as follows:
| Year Ended April 30, | ||||||||||||
| (in millions) |
2025 | 2024 | 2023 | |||||||||
| Pre-tax income |
||||||||||||
| United Kingdom |
$(5 | ) | $(31 | ) | $90 | |||||||
| Foreign |
||||||||||||
| United States |
2,018 | 2,106 | 2,005 | |||||||||
| Other |
57 | 19 | 57 | |||||||||
|
|
|
|
|
|
|
|||||||
| $2,070 | $2,094 | $2,152 | ||||||||||
|
|
|
|
|
|
|
|||||||
The components of the provision (benefit) for income taxes for each of the three years in the period ended April 30, 2025 are as follows:
| Year Ended April 30, | ||||||||||||
| (in millions) |
2025 | 2024 | 2023 | |||||||||
| Current |
||||||||||||
| United Kingdom |
$(6 | ) | $2 | $25 | ||||||||
| Foreign |
||||||||||||
| United States - Federal |
410 | 195 | 128 | |||||||||
| United States - State and local |
69 | 80 | 96 | |||||||||
| Other |
2 | 9 | 17 | |||||||||
|
|
|
|
|
|
|
|||||||
| 475 | 286 | 266 | ||||||||||
|
|
|
|
|
|
|
|||||||
F-54
Table of Contents
Ashtead Group plc
Notes to Consolidated Financial Statements
| Year Ended April 30, | ||||||||||||
| (in millions) |
2025 | 2024 | 2023 | |||||||||
| Deferred |
||||||||||||
| United Kingdom |
12 | (7 | ) | (1 | ) | |||||||
| Foreign |
||||||||||||
| United States - Federal |
1 | 232 | 273 | |||||||||
| United States - State and local |
16 | 14 | 11 | |||||||||
| Other |
13 | (3 | ) | (2 | ) | |||||||
|
|
|
|
|
|
|
|||||||
| 42 | 236 | 281 | ||||||||||
|
|
|
|
|
|
|
|||||||
| Total |
$517 | $522 | $547 | |||||||||
|
|
|
|
|
|
|
|||||||
A reconciliation of the provision (benefit) for income taxes and the amount computed by applying the UK statutory income tax rate (25% in 2024 and 2025, 19.49% in 2023 as the tax rate changed from 19% to 25% on April 1, 2023) to the income before provision (benefit) for income taxes for each of the three years in the period ended April 30, 2025 is as follows:
| Year Ended April 30, | ||||||||||||||||||||||||
| (in millions) |
2025 | 2024 | 2023 | |||||||||||||||||||||
| Computed tax at statutory tax rate |
$517 | 25% | $523 | 25% | $420 | 19% | ||||||||||||||||||
| Foreign Tax Effects |
||||||||||||||||||||||||
| United States |
||||||||||||||||||||||||
| Statutory tax rate difference |
(81 | ) | (4% | ) | (84 | ) | (4% | ) | 30 | 2% | ||||||||||||||
| State and local tax |
70 | 3% | 77 | 4% | 87 | 4% | ||||||||||||||||||
| Other |
4 | — | 1 | — | — | — | ||||||||||||||||||
| Other foreign jurisdictions |
1 | — | 2 | — | 4 | — | ||||||||||||||||||
| Nontaxable or nondeductible items |
6 | 1% | 3 | — | 6 | — | ||||||||||||||||||
|
|
|
|
|
|
|
|||||||||||||||||||
| Total |
$517 | 25% | $522 | 25% | $547 | 25% | ||||||||||||||||||
|
|
|
|
|
|
|
|||||||||||||||||||
State taxes in California, Florida, Illinois, New York, Tennessee and Pennsylvania make up the majority (greater than 50%) of the tax effect in the state and local tax category. There are no effects of changes in tax law or rates enacted in the periods, effects of cross-border tax laws, tax credits, changes in valuation allowances or changes in unrecognized tax benefits which are material for separate disclosure. The impact of the change in UK tax rate in 2023 was not material as the tax rate had been enacted in a prior period and as such the revaluation of the UK deferred tax balances occurred prior to 2023.
Income tax paid (refunded) for each of the three years in the period ended April 30, 2025 is as follows:
| Year Ended April 30, | ||||||||||||
| (in millions) |
2025 | 2024 | 2023 | |||||||||
| United Kingdom |
$(41 | ) | $1 | $31 | ||||||||
| Foreign |
||||||||||||
| United States – Federal |
397 | 149 | 142 | |||||||||
| United States – State and Local |
63 | 89 | 96 | |||||||||
| Other |
6 | 7 | 18 | |||||||||
|
|
|
|
|
|
|
|||||||
| Total |
$425 | $246 | $287 | |||||||||
|
|
|
|
|
|
|
|||||||
F-55
Table of Contents
Ashtead Group plc
Notes to Consolidated Financial Statements
The components of deferred income tax assets (liabilities) are as follows:
| Year Ended April 30, | ||||||||||||
| (in millions) |
2025 | 2024 | 2023 | |||||||||
| Deferred tax assets: |
||||||||||||
| Leases |
$696 | $666 | $591 | |||||||||
| Accruals and reserves |
172 | 198 | 164 | |||||||||
| Net operating loss and credit carryforwards |
28 | 44 | 40 | |||||||||
| Capital loss carryforwards |
15 | 10 | 10 | |||||||||
| Interest carryforwards |
1 | 50 | 27 | |||||||||
|
|
|
|
|
|
|
|||||||
| Total deferred tax assets |
912 | 968 | 832 | |||||||||
| Less: valuation allowance |
(18 | ) | (13 | ) | (27 | ) | ||||||
|
|
|
|
|
|
|
|||||||
| Total net deferred tax assets |
894 | 955 | 805 | |||||||||
| Deferred tax liabilities: |
||||||||||||
| Property and equipment |
(2,400 | ) | (2,463 | ) | (2,148 | ) | ||||||
| Leases |
(644 | ) | (618 | ) | (551 | ) | ||||||
| Intangibles |
(131 | ) | (116 | ) | (102 | ) | ||||||
| Other deferred tax liability |
(7 | ) | (6 | ) | (5 | ) | ||||||
|
|
|
|
|
|
|
|||||||
| Total deferred tax liability |
(3,182 | ) | (3,203 | ) | (2,806 | ) | ||||||
|
|
|
|
|
|
|
|||||||
| Total net deferred tax liability |
$(2,288 | ) | $(2,248 | ) | $(2,001 | ) | ||||||
|
|
|
|
|
|
|
|||||||
As of April 30, 2025, the Company has gross net operating loss carryforwards of $26 million related to the UK and $183 million related to US state jurisdictions that can be carried forwarded indefinitely, $86 million of gross net operating losses related US state jurisdictions that will expire between 2037 and 2038 and $9 million of gross net operating losses related to other foreign jurisdictions that will expire in 2044.
A valuation allowance has been provided where it is more likely than not that the deferred tax assets related to those operating loss carryforwards or gross temporary differences will not be realized. The following table presents the changes in the carrying amount of the valuation allowance for each of the three years in the period ended April 30, 2025:
| Year Ended April 30, | ||||||||||||
| (in millions) |
2025 | 2024 | 2023 | |||||||||
| Beginning balance |
$13 | $27 | $22 | |||||||||
| Increase (decrease) in valuation allowance |
4 | (14 | ) | 5 | ||||||||
| Foreign exchange |
1 | — | — | |||||||||
|
|
|
|
|
|
|
|||||||
| Ending balance |
$18 | $13 | $27 | |||||||||
|
|
|
|
|
|
|
|||||||
The Company is asserting indefinite reinvestment on foreign earnings. As of April 30, 2025, 2024 and 2023, unremitted earnings of overseas subsidiaries were $142, $126 and $103 million, respectively, which if distributed as dividends may be subject to withholding tax of 5%.
The Company conducts operations globally, and, as part of their global business, files numerous tax returns. The Company is routinely examined by various taxing authorities. The Company’s global tax positions are reviewed by management on a regular basis. Based on these reviews, the results of discussions and resolutions of matters with certain tax authorities, tax rulings and court decisions and the expiration of statute of limitations, unrecognized tax benefits are adjusted as necessary.
F-56
Table of Contents
Ashtead Group plc
Notes to Consolidated Financial Statements
The tax years that remain subject to examination by tax authorities as of April 30, 2025 are 2022-2024 for the United States, 2023-2024 for the United Kingdom and 2022-2024 for Canada.
The Company recognizes benefits from tax positions only if it is more likely than not that the tax position will be sustained on examination by the taxing authorities, based on the technical merits of the positions. The tax benefits recognized in the consolidated financial statements from such positions are measured as the largest amount of tax benefit that is greater than 50 percent likely of being realized upon settlement.
The following table provides a reconciliation of the total amounts of unrecognized tax benefits:
| Year Ended April 30, | ||||||||||||
| (in millions) |
2025 | 2024 | 2023 | |||||||||
| Balance at beginning of year |
$5 | $5 | $5 | |||||||||
| Gross increases related to prior period positions |
— | — | — | |||||||||
| Gross decreases related to prior period positions |
— | — | — | |||||||||
| Gross decreases related to expiration of statute of limitations |
— | — | — | |||||||||
| Foreign exchange |
||||||||||||
|
|
|
|
|
|
|
|||||||
| Balance at end of year |
$5 | $5 | $5 | |||||||||
|
|
|
|
|
|
|
|||||||
As of April 30, 2025, 2024 and 2023, there are $5 million of unrecognized tax benefits that would favorably impact the effective tax rate if recognized.
The Company recognizes interest and penalties in the income tax provision in the Consolidated Statements of Operations. As of April 30, 2025, 2024 and 2023, the Company had accrued interest and penalties $1 million. For the years ended April 30, 2025, 2024 and 2023, there was no movement reported in income tax expense related to interest and penalties.
| 16. | Commitments and Contingencies |
The Company is subject to a number of claims and proceedings that generally arise in the ordinary conduct of the business. These matters include, but are not limited to, general liability claims (including personal injury, product liability, and property and automobile claims), indemnification and guarantee obligations, employee injuries and employment-related claims, self-insurance obligations and contract and real estate matters. The Company believes that any liabilities ultimately resulting from these ordinary course claims and proceedings will not, individually or in the aggregate, have a material adverse effect on the consolidated financial position, results of operations or cash flows.
Capital commitments
As of April 30, 2025, capital commitments in respect of purchase of rental and other equipment totaled $0.5 billion, all of which has been ordered. There were no other material capital commitments at the year end.
F-57
Table of Contents
Ashtead Group plc
Notes to Consolidated Financial Statements
| 17. | Stock-Based Compensation |
Liability-classified awards
A summary of the transactions within the Company’s liability-classified long-term incentive awards is as follows:
| Shares | ||||
| Outstanding as of April 30, 2022 |
2,674,426 | |||
| Granted |
694,185 | |||
| Exercised |
(442,169 | ) | ||
| Expired/lapsed |
(51,280 | ) | ||
|
|
|
|||
| Outstanding as of April 30, 2023 |
2,875,162 | |||
| Granted |
444,209 | |||
| Exercised |
(480,582 | ) | ||
| Expired/lapsed |
(98,453 | ) | ||
|
|
|
|||
| Outstanding as of April 30, 2024 |
2,740,336 | |||
| Granted |
690,192 | |||
| Exercised |
(1,501,863 | ) | ||
| Reclassification to equity-classified awards |
(132,483 | ) | ||
| Expired/lapsed |
(149,765 | ) | ||
|
|
|
|||
| Outstanding and exercisable as of April 30, 2025 |
1,646,417 | |||
|
|
|
|||
The total fair value of the stock-based compensation awards related to liability-classified long-term incentive awards that vested was $98 million, $33 million and $19 million during the years ended April 30, 2025, 2024 and 2023, respectively.
$14 million, $32 million and $72 million was recognized as a long-term liability for the liability-classified awards under the long-term incentive plans in the “Other long-term liabilities” on the consolidated balance sheets as of April 30, 2025, 2024 and 2023, respectively. $17 million, $119 million and $27 million was recognized as a short-term liability for the liability-classified awards under the long-term incentive plans in the “Accrued expenses and other liabilities” on the consolidated balance sheets as of April 30, 2025, 2024 and 2023, respectively. As of April 30, 2025, there was $24 million of total unrecognized compensation cost related to the liability-classified awards expected to be recognized over a weighted-average period of 1.0 years. The amount of unrecognized compensation cost will fluctuate over time as they are marked to market. The weighted average remaining contractual term of the liability-classified share options outstanding as of April 30, 2025 was 3.3 years.
Equity-classified awards
A summary of the transactions within the Company’s equity-classified long-term incentive awards is as follows:
| Shares | Weighted-Average Fair Value |
|||||||
| Outstanding as of April 30, 2022 |
312,013 | $34.71 | ||||||
| Granted |
128,006 | 28.03 | ||||||
| Exercised |
(99,835 | ) | 19.78 | |||||
| Expired/lapsed |
(1,315 | ) | 19.78 | |||||
|
|
|
|||||||
| Outstanding as of April 30, 2023 |
338,869 | 36.64 | ||||||
| Granted |
82,850 | 48.15 | ||||||
| Exercised |
(86,816 | ) | 24.12 | |||||
F-58
Table of Contents
Ashtead Group plc
Notes to Consolidated Financial Statements
| Shares | Weighted-Average Fair Value |
|||||||
| Expired/lapsed |
— | — | ||||||
|
|
|
|||||||
| Outstanding as of April 30, 2024 |
334,903 | 42.74 | ||||||
| Granted |
204,465 | 49.80 | ||||||
| Reclassification from liability-classified awards |
132,483 | 64.00 | ||||||
| Exercised |
(124,527 | ) | 54.82 | |||||
| Expired/lapsed |
(3,638 | ) | 47.32 | |||||
|
|
|
|||||||
| Outstanding and exercisable as of April 30, 2025 |
543,686 | $44.41 | ||||||
|
|
|
|||||||
The total fair value of the stock-based compensation awards that vested was $8 million, $6 million and $4 million during the years ended April 30, 2025, 2024 and 2023, respectively.
As of April 30, 2025, there was $13 million of total unrecognized compensation cost related to the equity-classified awards expected to be recognized over a weighted-average period of 1.4 years. The weighted average remaining contractual term of the equity-classified share options outstanding as of April 30, 2025 was 4.7 years.
Stock-based compensation expense
The expenses and associated income tax benefits recognized are as follows:
| Year Ended April 30, | ||||||||||||
| (in millions) |
2025 | 2024 | 2023 | |||||||||
| Liability-classified awards |
||||||||||||
| Compensation (credit) expense |
$(14 | ) | $87 | $48 | ||||||||
| Income tax (benefit) expense |
2 | (23 | ) | (13 | ) | |||||||
|
|
|
|
|
|
|
|||||||
| Total |
$(12 | ) | $64 | $35 | ||||||||
|
|
|
|
|
|
|
|||||||
| Equity-classified awards |
||||||||||||
| Compensation expense |
$5 | $5 | $5 | |||||||||
| Income tax benefit |
— | — | — | |||||||||
|
|
|
|
|
|
|
|||||||
| Total |
$5 | $5 | $5 | |||||||||
|
|
|
|
|
|
|
|||||||
The Company’s stock-based compensation expense is included in selling, general and administrative expense in the Company’s consolidated statements of income.
Assumptions
The following assumptions were used in the Monte Carlo simulation model for the long-term incentive awards:
| Year Ended April 30, | ||||||
| (in millions) |
2025 | 2024 | 2023 | |||
| Expected volatility |
32.80% - 32.82% | 32.43% - 32.44% | 32.66% | |||
| Risk-free interest rate |
3.79% - 3.82% | 4.40% - 4.83% | 4.02% - 4.19% | |||
| Expected term |
1.00 - 2.00 | 1.00 - 2.00 | 1.00 - 2.00 | |||
| Dividend yield |
0.00% | 0.00% | 0.00% | |||
F-59
Table of Contents
Ashtead Group plc
Notes to Consolidated Financial Statements
18. Retirement Benefits Plans
Defined contribution plans
The Company contributes to defined contribution plans substantially covering all qualifying employees. $48 million, $47 million, and $40 million was recorded in the consolidated statements of income related to contributions payable to these plans by the Company at rates specified in the rules of the plans for the fiscal years ended April 30, 2025, 2024, and 2023, respectively. The expenses associated with these contributions was recorded in selling, general and administrative expense on the consolidated statements of income.
Defined benefit plan
The following table provides a reconciliation of benefit obligations and plan assets of the Company’s defined benefit pension plan:
| As of April 30, | ||||||||||||
| (in millions) |
2025 | 2024 | 2023 | |||||||||
| Changes in Projected Benefit Obligations |
||||||||||||
| Benefit obligations at beginning of year |
$85 | $88 | $123 | |||||||||
| Interest cost |
4 | 4 | 4 | |||||||||
| Benefits paid |
(4 | ) | (4 | ) | (4 | ) | ||||||
| Actuarial gain |
(7 | ) | (3 | ) | (33 | ) | ||||||
| Foreign exchange movement |
5 | — | (2 | ) | ||||||||
|
|
|
|
|
|
|
|||||||
| Benefit obligations at end of year |
83 | 85 | 88 | |||||||||
|
|
|
|
|
|
|
|||||||
| Change in Fair Value of Plan Assets |
||||||||||||
| Fair value of plan assets at beginning of year |
84 | 106 | 141 | |||||||||
| Interest income |
4 | 5 | 4 | |||||||||
| Loss on plan assets |
(7 | ) | (25 | ) | (36 | ) | ||||||
| Employer contribution |
— | 3 | 2 | |||||||||
| Benefits paid |
(4 | ) | (4 | ) | (4 | ) | ||||||
| Foreign exchange movement |
5 | (1 | ) | (1 | ) | |||||||
|
|
|
|
|
|
|
|||||||
| Fair value of plan assets at end of year |
82 | 84 | 106 | |||||||||
|
|
|
|
|
|
|
|||||||
| Funded status |
$(1 | ) | $(1 | ) | $18 | |||||||
|
|
|
|
|
|
|
|||||||
| As of April 30, | ||||||||||||
| (in millions) |
2025 | 2024 | 2023 | |||||||||
| Amounts Recognized in Balance Sheet |
||||||||||||
| Other long-term liabilities |
$(1 | ) | $— | $18 | ||||||||
|
|
|
|
|
|
|
|||||||
| Net amount recognized |
$(1 | ) | $— | $18 | ||||||||
| Weighted-Average Assumptions Used to Determine Projected Benefit Obligations |
||||||||||||
| Discount rate |
5.6 | % | 5.2 | % | 4.8 | % | ||||||
| Inflation assumption – RPI |
2.9 | % | 3.2 | % | 3.2 | % | ||||||
| CPI |
2.3 | % | 2.7 | % | 2.3 | % | ||||||
| Rate of pension increase in payment |
2.8 | % | 3.0 | % | 3.0 | % | ||||||
| Expected return on plan assets |
5.6 | % | 5.2 | % | 4.0 | % | ||||||
F-60
Table of Contents
Ashtead Group plc
Notes to Consolidated Financial Statements
The following table sets forth the net periodic pension cost (benefit):
| Year Ended April 30, | ||||||||||||
| (in millions) |
2025 | 2024 | 2023 | |||||||||
| Components of Net Periodic Pension Cost (Benefit) |
||||||||||||
| Interest cost |
$4 | $4 | $4 | |||||||||
| Expected return on plan assets |
(4 | ) | (4 | ) | (6 | ) | ||||||
| Net amortization of actuarial net loss |
— | 22 | 5 | |||||||||
|
|
|
|
|
|
|
|||||||
| Net periodic pension cost (benefit) |
$— | $22 | $3 | |||||||||
|
|
|
|
|
|
|
|||||||
The discount rate used is the yield at the balance sheet date on AA-rated corporate bonds. The calculation is performed by a qualified actuary using the projected unit credit method.
The plan’s assets are invested in the following asset classes along with their fair value hierarchy:
| As of April 30, | ||||||||||||||||
| (in millions) |
2025 | 2024 | 2023 | |||||||||||||
| Asset Category |
||||||||||||||||
| Buy and maintain fund |
Level 2 | $— | $— | $18 | ||||||||||||
| Liability driven investment funds |
Level 2 | — | — | 77 | ||||||||||||
| Insurance policies |
Level 2 | 82 | 84 | — | ||||||||||||
| Cash and cash equivalents |
Level 1 | — | — | 11 | ||||||||||||
|
|
|
|
|
|
|
|||||||||||
| Total |
$82 | $84 | $106 | |||||||||||||
|
|
|
|
|
|
|
|||||||||||
The following table presents estimated future benefit payments (in millions):
| For the year ending 30 April, |
||||
| 2026 |
$4 | |||
| 2027 |
4 | |||
| 2028 |
4 | |||
| 2029 |
4 | |||
| 2030 |
5 | |||
| Thereafter |
24 | |||
|
|
|
|||
| Total |
$45 | |||
|
|
|
19. Earnings Per Share
The following table sets forth the computation of basic and diluted earnings per share:
| Year Ended April 30, | ||||||||||||
| (in millions) |
2025 | 2024 | 2023 | |||||||||
| Numerator: |
||||||||||||
| Net income |
$1,553 | $1,572 | $1,605 | |||||||||
| Denominator: |
||||||||||||
| Denominator for basic earnings per share—weighted-average common shares |
435,873,592 | 436,988,043 | 439,086,356 | |||||||||
| Effect of dilutive securities: |
||||||||||||
| Employee share options and share plan awards |
1,078,328 | 2,349,673 | 1,951,930 | |||||||||
|
|
|
|
|
|
|
|||||||
| Denominator for diluted earnings per share—weighted-average common shares |
436,951,920 | 439,337,716 | 441,038,286 | |||||||||
|
|
|
|
|
|
|
|||||||
| Basic earnings per share |
$3.56 | $3.60 | $3.66 | |||||||||
| Diluted earnings per share |
$3.55 | $3.58 | $3.64 | |||||||||
F-61
Table of Contents
Ashtead Group plc
Notes to Consolidated Financial Statements
20. Subsequent Events
Between June and September 2025, the Company acquired two specialty businesses and two general tool businesses in North America. The purchase price for these acquisitions is not material. The initial accounting for these acquisitions is incomplete given the proximity to the year end. Had these acquisitions taken place on May 1, 2024, their contribution to revenue and net income would not have been material.
The Company has evaluated subsequent events through September 5, 2025, the date the audited annual consolidated financial statements were available to be issued.
F-62